
4.3 Guessing Correlations
This section is an interactive demonstration. The live simulation runs on the original site: open the demonstration at onlinestatbook.com.
Learning Objectives
- Learn how to estimate Pearson's correlation coefficient by viewing scatter plots.
Instructions
This demonstration allows you to learn about Pearson's correlation by viewing scatter plots with different values of Pearson's r. In each case, you will have an opportunity to guess the correlation. With a little practice, you should get pretty good at it.
Illustrated Instructions
The demonstration begins by displaying a scatterplot (shown below) and you guess what the correlation of the data in the scatterplot is by selecting one of 5 options below the graph. 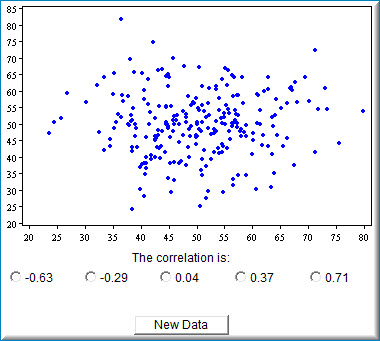
As can be seen in screenshots below, once you select an answer you will be prompted whether the answer is correct or incorrect. Click the "New Data" to get a new dataset.
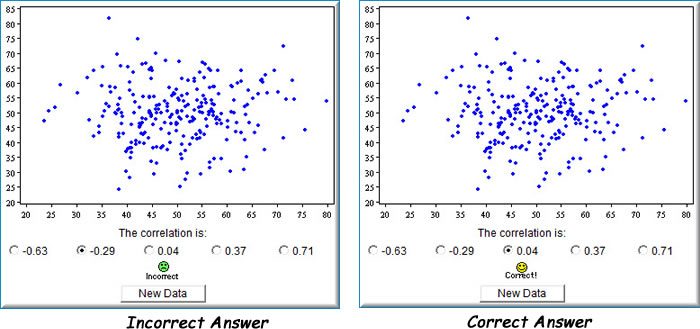
Guess the correlation of the data in the scatterplot by selecting from the options below the graph. You can change the data by clicking on the "New Data" button.
Adapted from Online Statistics Education: A Multimedia Course of Study (onlinestatbook.com), Project Leader: David M. Lane, Rice University. Developed with NSF support. The original work is in the public domain; it is cited here at the authors' request. Changes were made: reformatted as an accessible XYZ web edition with native MathML. License: Public-Domain.