
3.16 Comparing Distributions Demo
This section is an interactive demonstration. The live simulation runs on the original site: open the demonstration at onlinestatbook.com.
Learning Objectives
- Become more familiar with collecting data and presenting statistics from this data.
- Learn how one might compare data from two distributions.
Instructions
This demonstration collects response time data from you and computes various descriptive statistics. It also displays histograms and box plots. After you click the button to begin, a rectangle will appear to the right of the button. Move the cursor to the rectangle and click. The time it takes you to click on the rectangle is recorded. Half of the time the rectangle is small and half of the time it is big. After two practice trials and 40 regular trials, the descriptive statistics and graphs will be displayed.
Illustrated Instructions
The simulation is started by clicking the button in the lower left of the screen. Clicking this button begins a series of trials where a another button appears on the right and you will be asked to click this button as quickly as possible.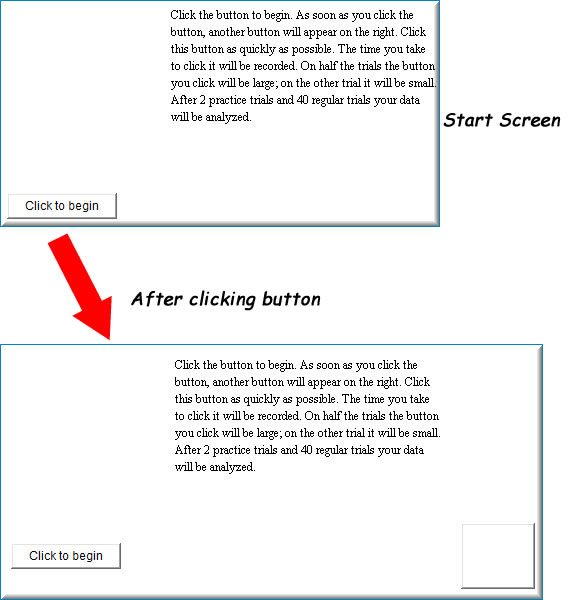
Half of the buttons will large and half will be small. Once you complete 40 trials, the simulation will show you descriptive statistics about the reaction time data for each button size (see screenshot below).
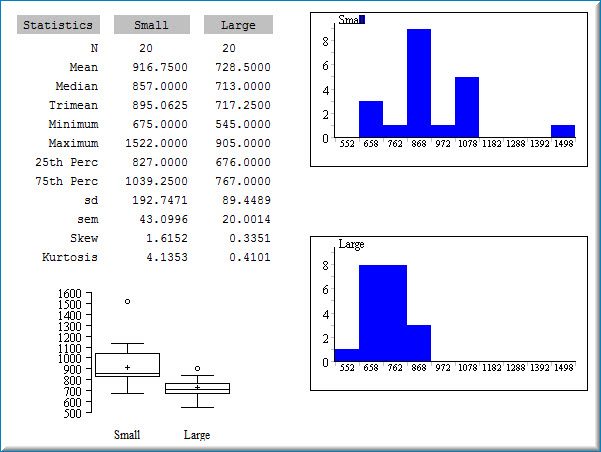
There are no questions for this simulation.
Follow the instructions accompanying the simulation. Compare the two distributions after completing the 40 trials. Are the differences what you expected?
Adapted from Online Statistics Education: A Multimedia Course of Study (onlinestatbook.com), Project Leader: David M. Lane, Rice University. Developed with NSF support. The original work is in the public domain; it is cited here at the authors' request. Changes were made: reformatted as an accessible XYZ web edition with native MathML. License: Public-Domain.