
3.14 Estimating Variance Simulation
This section is an interactive demonstration. The live simulation runs on the original site: open the demonstration at onlinestatbook.com.
Learning Objectives
- Understand what it means for a distribution to balance on a fulcrum
- Learn which measure of central tendency will balance a distribution.
Instructions
This simulation samples from the population of 50 numbers shown here. You can see that there are 10 instances of the values 1, 2, 3, 4, and 5. The mean of the population is therefore 3. The variance is the average squared deviation from the mean of 3. You can compute that this is exactly 2.
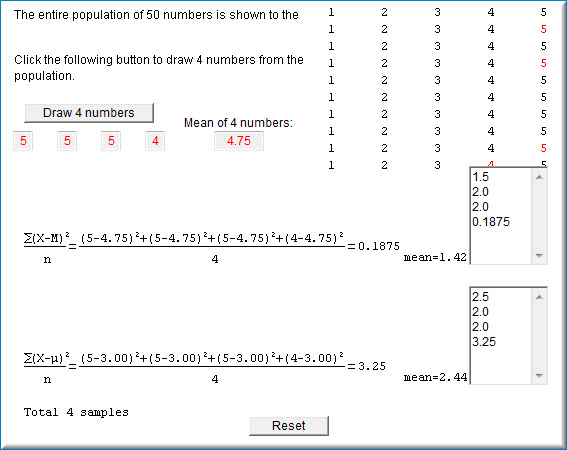
When you click on the button "Draw 4 numbers" four scores are sampled (with replacement) from the population. The four numbers are shown in red, as is the mean of the four numbers. The variance is then computed in two ways. The upper formula computes the variance by computing the mean of the squared deviations or the four sampled numbers from the sample mean. The lower formula computes the mean of the squared deviations or the four sampled numbers from the population mean of 3.00 (on rare occasions, the sample and population means will be equal). The computed variances are placed in the fields to the right of the formulas. The mean of the values in a field is shown at the bottom of the field. When there is only one value in the field, the mean will, of course, equal that value.
If you click the "Draw 4 numbers" button again, another four numbers will be sampled. The mean and variance will also be computed as before. The fields to the right of the formulas will hold both variances and the bottom of the field will show the mean of the variances.
The population variance is exactly 2. Use this fact to assess the relative value of the two formulas for variance. See which one, on average, approaches 2 and which one gives lower estimates. Explore whether either formula is always more accurate, or whether sometimes one is more accurate and at other times, the other formula is. If the variance based on the sample mean had been computed by dividing by N-1 = 3 instead of 4, then the variance would be 4/3 times bigger. Does multiplying the variance by 4/3 lead to better estimates?
Illustrated Instructions
As can be seen in the screenshot below, the variance estimation simulation begins by displaying a population of 50 numbers ranging from 1 - 5.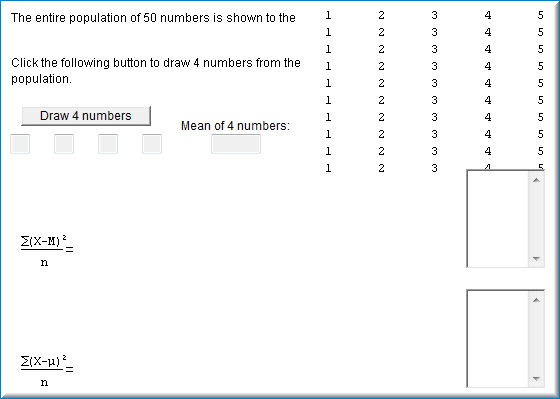
Each time the "Draw 4 numbers" button is clicked four numbers are sampled from the population and the mean, the variance of the sample from the sample mean as well as the variance of the sample from the population mean are calculated. The variances are stored in fields next to their respective formula. The screenshot below shows the simulation after the "Draw 4 numbers" button has been clicked four times.
 Use the simulation to explore whether either formula is on average more accurate than the other.
Click the "Draw 4 numbers" button below to sample 4 random numbers from the population on the left. The demonstration calculates the variance of the 4 numbers from the sample mean and the population mean and stores these values in the text fields on the right. Is any formula more accurate in estimating the population variance of 2?
Adapted from Online Statistics Education: A Multimedia Course of Study (onlinestatbook.com), Project Leader: David M. Lane, Rice University. Developed with NSF support. The original work is in the public domain; it is cited here at the authors' request. Changes were made: reformatted as an accessible XYZ web edition with native MathML. License: Public-Domain.