
11.1 One-Way ANOVA
The - and -tests can be used to test the equality between two population means and . When we have more than two groups, we would inflate the probability of making a type I error if we were to compare just two at a time and make a conclusion about all the groups together. To account for this P(Type I Error) inflation, we instead will do an analysis of variance (ANOVA) to test the equality between 3 or more population means .
The F-test (for ANOVA) is a statistical test for testing the equality of population means.
The one-way ANOVA F-test is a statistical test for testing the equality of population means from 3 or more groups within one variable or factor. There are many different types of ANOVA; for now, we are going to start with what is commonly referred to as a one-way ANOVA, which has one main effect or factor that is split up into three or more independent treatment levels. In more advanced courses you would learn about dependent groups or two or more factors.
Assumptions:
- The populations are normally distributed continuous variables with equal variances.
- The observations are independent.
The hypotheses for testing the equality of population means (ANOVA) are set up with all the means equal to one another in the null hypothesis and at least one mean is different in the alternative hypothesis.
At least one mean is different.
Even though there is equality in , the ANOVA test is testing if the variance between groups is significantly greater than the variance within groups; hence, this will always be set up as a right-tailed test.
We will be using abbreviations for many of the numbers found in this section.
B = Between, W = Within
MS = Mean Square (This is a variance)
MSB = Mean Square (Variance) Between groups.
MSW = Mean Square (Variance) Within groups.
The formula for the F-test statistic is .
Use the F-distribution with degrees of freedom from the between and within groups. The numerator degrees of freedom are equal to the number of groups minus one, that is numerator degrees of freedom are . The denominator degrees of freedom are equal to the total of all the sample sizes minus the number of groups, that is denominator degrees of freedom are .
The sum of squares, degrees of freedom and mean squares are organized in a table called an ANOVA table. Figure 11-1 below is a template for an ANOVA table.
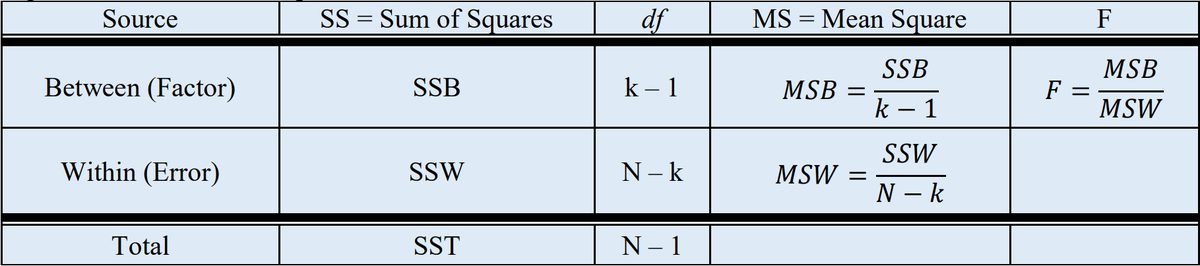
Where:
= sample mean from the group
= sample variance from the group
= sample size from the group
= number of groups
= sum of the individual sample sizes for groups
Grand mean from all groups =
Sum of squares between groups = SSB =
Sum of squares within groups = SSW =
Mean squares between groups (or the between-groups variance ) =
Mean squares within-group (or error within-groups variance ) =
is the test statistic.
These calculations can be time-consuming to do by hand, so use technology to find the ANOVA table values, critical value and/or p-value.
Different textbooks and computer software programs use different labels in the ANOVA tables.
- The TI-calculators use the word Factor for Between Groups and Error for Within Groups.
- Some software packages use Treatment instead of Between groups. You may see different notation depending on which textbook, software or video you are using.
- For between groups SSB = SSB = SSTR = SST = SSF and for within groups SSW = SSW = SSE.
- One thing that is consistent within the ANOVA table is that the between = factor = treatment always appears on the first row of the ANOVA table, and the within = error always is in the second row of the ANOVA table.
- The column usually is in the second column since we divide the sum of squares by the to find the mean squares. However, some software packages will put the column before the sum of squares column.
- The test statistic is under the column labeled F.
- Many software packages will give an extra column for the p-value and some software packages give a critical value too.
Assumption: The population we are sampling from must be approximately normal with equal variances. If these assumptions are not met there are more advanced statistical methods that should be used.
Summary
The ANOVA test gives evidence that there is a difference between three or more means. The null hypothesis will always have the means equal to one another versus the alternative hypothesis that at least one mean is different. The F-test results are about the difference in means, but the test is actually testing if the variation between the groups is larger than the variation within the groups. If this between group variation is significantly larger than the within groups then we can say there is a statistically significant difference in the population means. Hence, we are always performing a right-tailed F-test for ANOVA. Make sure to only compare the p-value with and the test statistic to the critical value.
Adapted from Mostly Harmless Statistics by Rachel Webb (Portland State University, https://mostlyharmlessstat.wixsite.com/webpage), © Rachel Webb, licensed under CC BY-SA 4.0. Changes were made. License: CC-BY-SA-4.0.