

2.3 Inequalities as Intervals on the Number Line
Narrated lesson: Inequalities as Intervals on the Number Line
Synthetic narration with English captions, a transcript, and time to think before checking the answer.
Read the transcriptDownload the videoNarration credits and licences
Graph Inequalities on the Number Line
Do you remember what it means for a number to be a solution to an equation? A solution of an equation is a value of a variable that makes a true statement when substituted into the equation.
What about the solution of an inequality? What number would make the inequality true? Are you thinking, ‘x could be 4’? That’s correct, but x could be 5 too, or 20, or even 3.001. Any number greater than 3 is a solution to the inequality .
We show the solutions to the inequality on the number line by shading in all the numbers to the right of 3, to show that all numbers greater than 3 are solutions. Because the number 3 itself is not a solution, we put an open parenthesis at 3. The graph of is shown in Figure 2.7. In these graphs, the thick coloured ray marks the solution set, and its arrow shows the direction in which the solutions continue.

The graph of the inequality is very much like the graph of , but now we need to show that 3 is a solution, too. We do that by putting a bracket at , as shown in Figure 2.8.

Notice that the open parentheses symbol, (, shows that the endpoint of the inequality is not included. The open bracket symbol, [, shows that the endpoint is included.
We can also represent inequalities using interval notation. As we saw above, the inequality means all numbers greater than 3. There is no upper end to the solution to this inequality. In interval notation, we express as The symbol is read as ‘infinity’. It is not an actual number. Figure 2.9 shows both the number line and the interval notation.

The inequality means all numbers less than or equal to 1. There is no lower end to those numbers. We write in interval notation as . The symbol is read as ‘negative infinity’. Figure 2.10 shows both the number line and interval notation.

Did you notice how the parenthesis or bracket in the interval notation matches the symbol at the endpoint of the arrow? These relationships are shown in Figure 2.11.

Section Exercises
Practice Makes Perfect
Graph Inequalities on the Number Line
In the following exercises, graph each inequality on the number line.
ⓐ
ⓑ ⓒ
ⓐ ⓑ
ⓒ
Show solution
- ⓐ

- ⓑ

- ⓒ

ⓐ ⓑ ⓒ
ⓐ ⓑ ⓒ
Show solution
- ⓐ

- ⓑ

- ⓒ

In the following exercises, graph each inequality on the number line and write in interval notation.
ⓐ ⓑ ⓒ
ⓐ ⓑ ⓒ
Show solution
- ⓐ
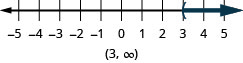
- ⓑ
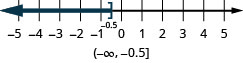
- ⓒ
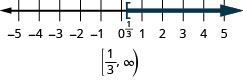
ⓐ ⓑ ⓒ
ⓐ ⓑ ⓒ
Show solution
- ⓐ
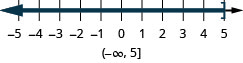
- ⓑ
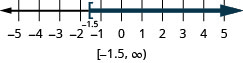
- ⓒ
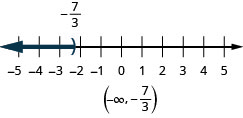
Corequisite Skills for Introductory Statistics is a custom course edition compiled for Introductory Statistics corequisite courses from OpenStax Contemporary Mathematics, Elementary Algebra 2e, Intermediate Algebra 2e, Prealgebra 2e. Content by OpenStax is reproduced as published, apart from any corrections recorded for this edition. Sections are renumbered to follow the course outline. The course outline is adapted from Larry Green's Support Course for Elementary Statistics (LibreTexts, https://stats.libretexts.org/Bookshelves/Introductory_Statistics/Support_Course_for_Elementary_Statistics), used under CC BY 4.0 (https://creativecommons.org/licenses/by/4.0/). Lessons 2.4 and 6.7 are written for this edition by XYZ Homework. Every OpenStax lesson is abridged to the subsections and practice exercises this course uses. Lessons are headed with their course titles, not the source section titles. Access the complete originals free at openstax.org. License: CC-BY-NC-SA-4.0.