
6.3 Graphs of the Circular Functions
We can graph the circular functions and just as we graphed trigonometric functions of angles in degrees. The only difference is that we scale the horizontal axis in radians.
The Sine and Cosine Functions
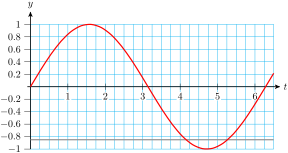
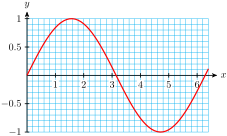
Consider the graph shown below.
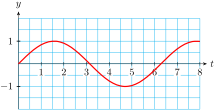
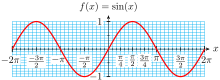
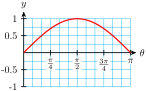
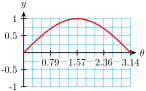
You can probably recognize this graph as one cycle of . For example, you can see that the graph completes one cycle at radians, or approximately 6.28. It reaches its maximum value, , at , or approximately 1.57. You should also notice that at , approximately 3.14.
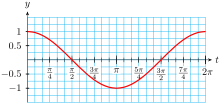
Instead of scaling the horizontal axis with integers, we often use multiples of . Using such a scale, we can show the exact location of the intercepts of the graph, and of its high and low points.
If we continued to plot points for values of greater than or less than 0, we would see the periodic behavior of the graph, as it repeats the same shape over each interval of length , just as it does for periods of when the angles are measured in degrees.
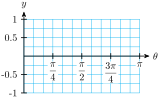
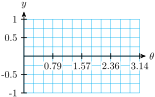
- Complete the table of values for .
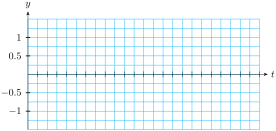
- Graph one cycle of , and scale the horizontal axis in multiples of . Use the
grid below.
The Tangent Function
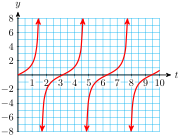
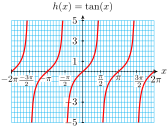
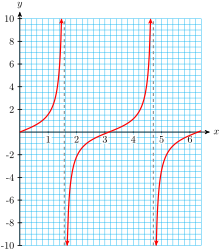
Finally, we consider the graph of the tangent function. Once again, the only difference between this new graph and our old version of the tangent graph in degrees is that the horizontal axis is scaled in radians.
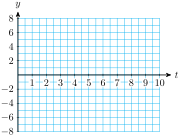
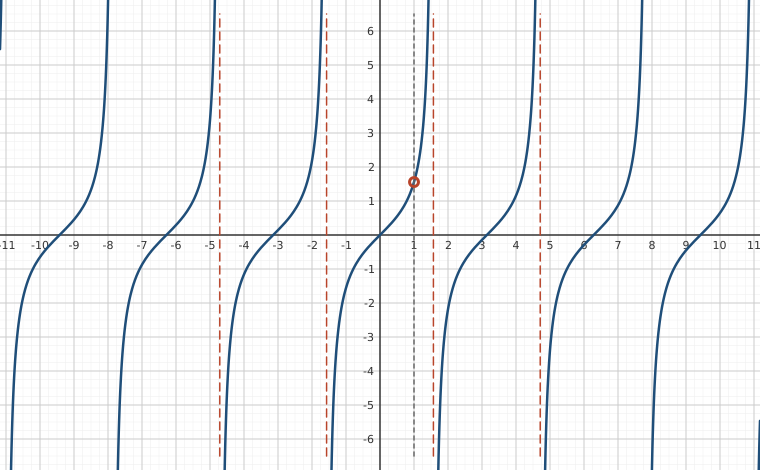
Sketch a graph of the tangent function and scale the horizontal axis in integers, as shown below. Label the -intercepts and the vertical asymptotes with their coordinates.
Solving Equations
We can use the graphs of the circular functions find solutions to trigonometric equations.
Use a graph to find the two angles between and that satisfy .
Approximately 4.14 and 5.25
We can also solve equations algebraically, using a calculator or computer to obtain more accurate values for the solutions.
- Solve the equation algebraically, for .
- Find all solutions of the equation.
- and
- and
We can find exact values for the solutions of equations involving the special values without using a calculator.
Find exact values for all the solutions of .
Modeling with Circular Functions
Now that we have defined trigonometric functions of real numbers, we can describe periodic phenomena as functions of time (or other variables besides angles).
For example, we began this chapter with a Ferris wheel of radius 100 feet that rotates once every 8 minutes. If you board the Ferris wheel at the bottom, your height is given as a function of time by
where is measured in minutes after boarding.
Thus, after minutes your height is
and after minutes your height is
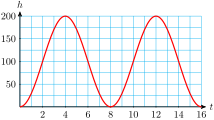
The graph of is shown above. From the graph, we see that the midline of the function is , its amplitude is 100, and its period is 8 (which is reasonable because the Ferris wheel rotates every 8 minutes). You can review period, midline, and amplitude of periodic functions in Section 4.3.
The pistons in an automobile engine move up and down in the cylinders. If is in milliseconds, the distance from the top of the piston to the top of the cylinder is given in centimeters by
- Graph the function on your calculator (make sure the calculator is set in radian mode).
- State the midline, amplitude, and period of the graph.
- Find the largest and the smallest clearance between the piston and the top of the cylinder.
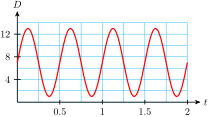
- Midline: , amplitude: , period: millisec
- Largest: 13 cm, smallest: 1 cm
Domain and Range
The domain of a function is the set of all possible input values. For many familiar functions, the domain is the set of all real numbers. In particular, the domain of any linear or quadratic function is the set of all real numbers.
Consider the functions and shown below. We can use any real number as an input for either of these functions, and their graphs extend across the entire -axis.
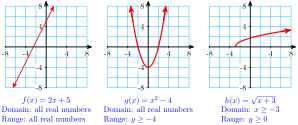
However, for other types of functions we must sometimes exclude certain values from the domain. For example, the domain of the function is restricted because we cannot take the square root of a negative number. We must have , so the domain of the function consists of all .
You can see the domain of a function in its graph; notice that there are no points on the graph of with -coordinates less than .
The range of a function is the set of all output values for the function. We can also see the range of a function in its graph; it is the set of all -values for points on the graph.
- Because the graph of extends infinitely in both directions, its range consists of all real numbers. There is an input value that will produce any output we want.
- However, the range of consists of all , because there are no points on the graph with -coordinate less than .
- The range of consists of all .
Use the formula and a graph to find the domain and range.
- Dom (): all real numbers except , Rge (): all real numbers except
- Dom (): , Rge ():
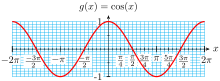
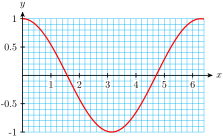
What about the domain and range of the trigonometric functions? The sine and cosine both include all real numbers in their domains; we can find the sine or cosine of any number. Because the output values of the sine and cosine are both defined by the coordinates of points on a unit circle, their values cannot be greater than or less than . The range of both sine and cosine is the interval .
The tangent function is undefined at odd multiples of (that is, at ), so those values must be excluded from its domain. However, the output values of the tangent function increase without bound as the input approaches from the left, and decrease from the right. The range of the tangent is all real numbers.
These facts about the three trigonometric functions appear in the Section 6.3 Summary.
Review the following skills you will need for this section.
Section 6.3 Summary
Vocabulary
- Domain
- Range
Concepts
- We can use circular functions of real numbers to describe periodic phenomena.
- The domain of a function is the set of all possible input values. The range of a function is the set of all output values for the function.
- We can use a graph to solve trigonometric equations, or the inverse trig keys on a calculator or computer. We can find exact values for the solutions of equations involving the special values without using a calculator.
Study Questions
- How do the graphs of the circular functions differ from the graphs of the trigonometric functions of angles in degrees?
- Use guidepoints to sketch graphs of and .
For each equation below, suppose that is one of the solutions between and . Use the diagram to find the other solution.

Skills
- Graph the trig functions of real numbers #1–8
- Solve trigonometric equations graphically #9–20
- Work with reference angles #21–26
- Solve trigonometric equations algebraically #27–52
- Evaluate trigonometric functions of real numbers #45–58
- Use trigonometric models #59–62
- Locate points on the graphs of the trigonometric functions #63–70
- Find the domain and range of a function #71–80
Homework 6.3
- Use your calculator to complete the table of values. Round values to hundredths.
Sketch a graph of on the grid.
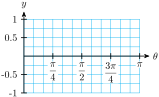
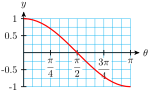
- Use your calculator to complete the table of values. Round values to hundredths.
Sketch a graph of on the grid.
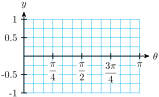
Sketch a graph of on each grid.
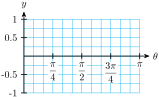
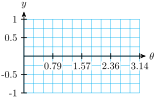
Sketch a graph of on each grid.
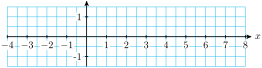
- Sketch a graph of where is a real number.
- State the domain and range of .
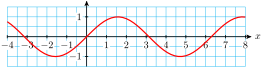
- Domain: , range:
- Sketch a graph of where is a real number.
- State the domain and range of .
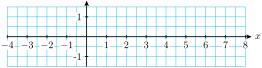
- Sketch a graph of where is a real number.
- State the domain and range of .
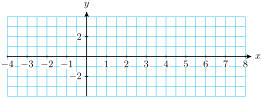
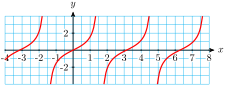
- Domain: an odd integer, range:
Sketch and on the same grid.
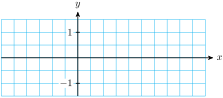
For Problems 9–10, use the figures below. Show your solutions on the graphs.
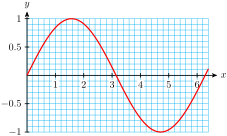
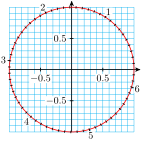
- Use the graph of to estimate two solutions of the equation .
- Use the unit circle to estimate two solutions of the equation .
- or
- or
- Use the graph of to estimate two solutions of the equation .
- Use the unit circle to estimate two solutions of the equation .
For Problems 11–12, use the figures below. Show your solutions on the graphs.
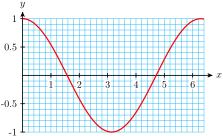
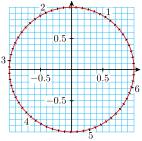
- Use the graph of to estimate two solutions of the equation .
- Use the unit circle to estimate two solutions of the equation .
- or
- or
- Use the graph of to estimate two solutions of the equation .
- Use the unit circle to estimate two solutions of the equation .
For Problems 13–20, use the graph of to estimate two solutions to the equation.
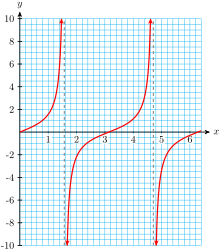
or
or
or
or
For Problems 21–26, find an angle in each quadrant, rounded to tenths, with the same reference angle as the angle given in radians.
I: 0.5, II: 2.7, III: 3.6, IV: 5.8
I: 0.6, II: 2.6, III: 3.7, IV: 5.7
I: 1.3, II: 1.8, III: 4.5, IV: 4.9
For Problems 27–32, find all solutions between and . Round to two decimal places. Sketch your solutions on a unit circle.
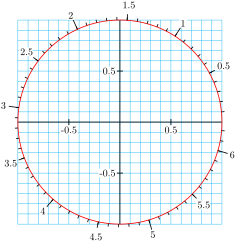
or
or
or
For Problems 33–44, solve the equation. Give exact values between and .
or
or
or
or
or
For Problems 45–52, use your calculator in radian mode. In part (a), evaluate the trigonometric function, and in part (b), find all solutions between and . Round your answers to two decimal places.
- No solution
For Problems 53–58, evaluate the function.
,
,
When observed from earth, the moon looks like a disk that is partially visible and partially in shadow. The percentage of the disk that is visible can be approximated by
where is the number of days since the last full moon.
Graph in the window
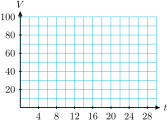
- Sketch the graph on the grid.
- Label on your graph the points that correspond to full moon, half moon, and new moon. (New moon occurs when the part of the moon receiving sunlight is facing directly away from the earth.)
- At what times during the lunar month is 25% of the moon visible? Mark those points on your graph.
- During which days is less than 50% of the moon visible? Mark the corresponding points on your graph.
b-c.
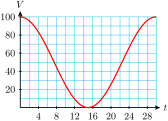
d. and e. to
The tide in Malibu is approximated by the function
measured in feet above low tide, where is the number of hours since the last low tide.
Graph in the window
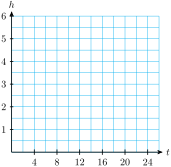
- Sketch the graph on the grid.
- Label on your graph the points that correspond to high tide and low tide.
- How high is high tide, and at what times does it occur?
- At what times during the 25-hour period is the tide 4 feet above low tide? Mark those points on your graph.
- Kathie walks along the beach only when the tide is below 1 foot. Find the intervals on your graph when the tide is below 1 foot.
The average daily high temperature in the town of Beardsley, Arizona is approximated by the function
where the temperature is measured in degrees Fahrenheit, and is the number of days since January 1.
Graph in the window
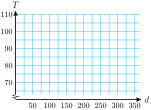
- Sketch the graph on the grid.
- Label on your graph the points that correspond to highest and lowest average temperature.
- What is the hottest day and what is its average temperature? What is the day with the lowest average temperature, and what is that temperature?
- At what times during the year are average high temperatures above ? Mark those points on your graph.
b-c.
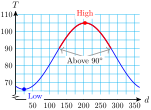
d. High: day 204, ; low: day 25, e. to
A weight is suspended from the ceiling on a spring. The weight is pushed straight up, compressing the spring, then released. The height of the weight above the ground is given by the function
where the height is measured in meters, and is the number of seconds since the mass was released.
Graph in the window
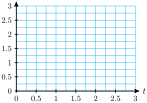
- Sketch the graph on the grid.
- Label on your graph the points that correspond to highest and lowest positions of the mass.
- How high is highest point, and when is that height attained during the first 3 seconds?
- How high is lowest point, and when is that height attained during the first 3 seconds?
- Find the intervals during the first 3 seconds when the mass is less than 2 meters above the ground.
For Problems 63–66, the figure shows an arc of length , and the coordinates of its terminal point. Find the terminal point of each related arc given below, and give its sine, cosine, and tangent.


Locate the four values and from Problem 63 on the graph of , on the graph of , and on the graph of shown below.
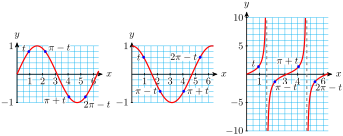
Repeat Problem 67 for the values in Problem 64.
Repeat Problem 67 for the values in Problem 65.
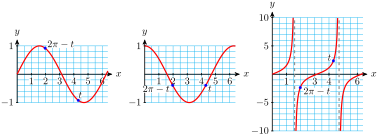
Repeat Problem 67 for the values in Problem 66.
For Problems 71–78,
- Sketch a graph of the function.
- State the domain and range of the function.

- Domain: , range:

- Domain: , range:

- Domain: , range:

- Domain: , range:
- Sketch a graph of , using the guidepoints in the table below.
- State the domain and range of the function .
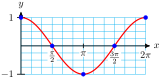
- Domain: , Range:
- Sketch a graph of , using the guidepoints in the table below.
- State the domain and range of the function .
Trigonometry by Katherine Yoshiwara (yoshiwarabooks.org), GNU Free Documentation License 1.2 or later. Adapted for the XYZ HTML edition with the authors' permission (recorded 2026-07-04). License: GFDL-1.2-or-later.