
4.2 Graphs of Trigonometric Functions
A Periodic Function of Angle
Imagine that you are riding on a Ferris wheel. As the wheel turns, your height above the ground increases and then decreases again, repeating the same pattern each time the Ferris wheel makes a complete rotation. This pattern is an example of a periodic function. We use periodic functions to model phenomena that exhibit cyclical behavior, such as the height of tides, seasonal patterns of growth in plants and animals, radio waves, and planetary motion.
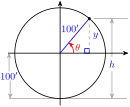
We'll create a mathematical model for a ride on a Ferris wheel that has a radius of 100 feet and rotates counterclockwise. Our model will be a function that describes your height above the ground as you ride the wheel. In order to graph the Ferris wheel function, we must first specify the input and output variables, and then choose a coordinate system to display their values.
We'll place the origin at the center of the Ferris wheel. Then the line from the origin to your position on the wheel makes an angle with the horizontal, as shown at right. This angle, , will be the input variable for the function. Your height, , is also a variable, and is related to the -coordinate of your position; in fact, we see that , because the center of the wheel is 100 feet above the ground.
To simplify the model, we'll first graph as the output variable, instead of . As the angle increases from to , your -coordinate increases from 0 to 100. You are then at the top of the wheel. Then, as increases from to , your -coordinate decreases from 100 back to 0.
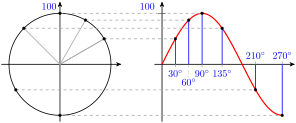
Finally, as increases from to , your -coordinate decreases from 0 to and then increases from back to 0. You have made one complete rotation on the Ferris wheel. If you go around again, increases from to , and the graph of your -coordinate will repeat the pattern of the first rotation. The figure above shows how your -coordinate is plotted as a function of the angle .
Look back at the diagram of the Ferris wheel and notice that , so
For example, when , the -coordinate is
and your height above the ground is
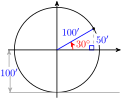
In general, then, is given as a function of by
This is our model for your height on a Ferris wheel ride.
The Sine Function
Our Ferris wheel model used values of , so let us explore its properties. Remember that the trigonometric ratio is actually a function of the angle . Thus, for each value of , there is only one value of , and we may write .
If we continue the graph for angles larger than or smaller than , we find that the same pattern repeats, as shown below. This should not be surprising, because we know that coterminal angles have the same trigonometric ratios.
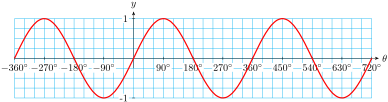
The sine is an example of a periodic function. The smallest interval on which the graph repeats is called the period of the graph. From the graph in the previous example, we make the following observations:
You can use your calculator to graph the sine function, by entering
SIN
and pressing ZOOM for the trig window. The graph shows two periods of the sine function, from to .
Your height on the Ferris wheel is a function of ,
- Complete the table of values and graph the Ferris wheel function, .
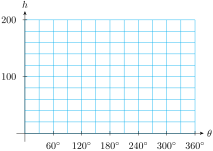
- Give the period, amplitude, and midline of the graph.
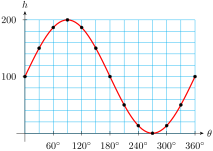
- Period: , amplitude: 100, midline:
The Cosine Function
In the previous exercise you graphed the height of a person riding on a Ferris wheel. Your graph involved , because the sine function tells us the -coordinate of a point that travels around a circle. The cosine function tells us the -coordinate of a point that travels around a circle.
In the example above, the period is , the amplitude is 18 cm, and the midline is .
You can see that the cosine graph is similar to the sine graph, but they are not identical.
- Complete the table below with values rounded to two decimal places. Use the table and your knowledge of reference angles to graph the cosine function, from to .
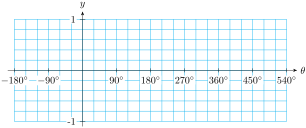
- Use your graph to find the period, amplitude, and midline of the cosine function. How does the graph of cosine differ from the graph of sine? (Hint: Consider the intercepts of the graph, and the location of the maximum and minimum values.)
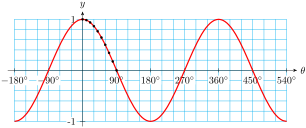
- Period: , amplitude: , midline: . The cosine graph starts at its high point, while the sine graph starts at its midline.
Interlude: Review of Function Notation
Perhaps it is time to review our use of function notation. Recall that we use the notation to indicate that is a function of , that is, is the input variable and is the output variable.
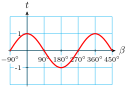
Of course, we don't always use and for the input and output variables. In the previous example, we could write for the function, so that is the input and is the output. The table of values and the graph are the same; only the names of the variables have changed.
Sketch a graph of each function, and label the axes.
In particular, we label the axes with the given variables.
The Tangent Function
The tangent function is periodic, but its graph is not similar to the graphs of sine and cosine. Recall that the tangent of an angle in standard position is defined by
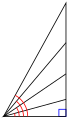
Study the figure at right to see that as increases from to , increases while remains constant, so the value of increases.
Now let's consider the graph of in the third and fourth quadrants. The tangent is positive in the third quadrant, and negative in the fourth quadrant. In fact, from the figure below you can see that the angles and are vertical angles.
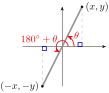

Because and have the same reference angle, they have the same tangent. For example,
Thus, the graph of in the third quadrant is the same as its graph in the first quadrant. Similarly, the graph of the tangent function in the fourth quadrant is the same as its graph in the second quadrant. The completed graph is shown below.
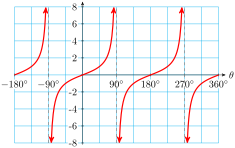
- What is the period of the tangent function?
- Does the graph of tangent have an amplitude?
- For what values of is undefined?
- Give the equations of any horizontal or vertical asymptotes for .
- No
- , and their coterminal angles
- The graph has vertical asymptotes at and
Period, Midline and Amplitude
All sine and cosine graphs have the characteristic "wave" shape we've seen in previous examples. But we can alter the size and frequency of the waves by changing the formula for the function. In the next example we consider three variations of the sine function.
The graphs in the previous example illustrate a general rule about sine and cosine graphs.
Sketch a graph for each of the following functions. Describe how each is different from the graph of .
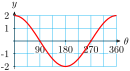
The amplitude is 2.
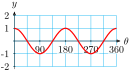
The period is .
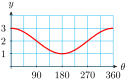
The midline is .
The quantities and in the equations above are called parameters, and their values for a particular function give us information about its graph.
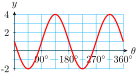
State the period, midline, and amplitude of the graph of
and graph the function.
Amplitude , period , midline
Section 4.2 Summary
Vocabulary
- Input variable
- Output variable
- Periodic function
- Period
- Midline
- Amplitude
- Asymptote
Concepts
- We use the notation to indicate that is a function of , that is, is the input variable and is the output variable.
- Periodic functions are used to model phenomena that exhibit cyclical behavior.
- The trigonometric ratios and are functions of the angle .
- The period of the sine function is . Its midline is the horizontal line , and the amplitude of the sine function is 1.
- The graph of the cosine function has the same period, midline, and amplitude as the graph of the sine function. However, the locations of the intercepts and of the maximum and minimum values are different.
- The tangent function has period . It is undefined at odd multiples of , and is increasing on each interval of its domain.
Study Questions
Use the figure to help you fill in the blanks.

- As increases from to , ______ from ____ to ____.
- As increases from to , ______ from ____ to ____.
- As increases from to , ______ from ____ to ____.
- As increases from to , ______ from ____ to ____.
Use the figure to help you fill in the blanks.

- As increases from to , ______ from ____ to ____.
- As increases from to , ______ from ____ to ____.
- As increases from to , ______ from ____ to ____.
- As increases from to , ______ from ____ to ____.
- List several ways in which the graph of is different from the graphs of and .
- State the period, midline, and amplitude of the graph of .
Skills
- Sketch graphs of the sine and cosine functions #1-4, 9-10, 19-22
- Find the coordinates of points on a sine or cosine graph #5-8, 37-42
- Use function notation #11-18
- Graph the tangent function #23-24
- Write an equation for a sine or cosine graph #25-30, 49-66
- Graph a sine or cosine function and state the period, midline, and amplitude #31-36, 43-48
Homework 4.2
- Prepare a graph with the horizontal axis scaled from to in multiples of .
- Sketch a graph of by plotting points for multiples of .
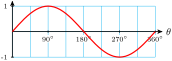
- Prepare a graph with the horizontal axis scaled from to in multiples of .
- Sketch a graph of by plotting points for multiples of .
- Prepare a graph with the horizontal axis scaled from to in multiples of .
- Sketch a graph of by plotting points for multiples of .
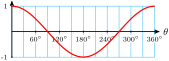
- Prepare a graph with the horizontal axis scaled from to in multiples of .
- Sketch a graph of by plotting points for multiples of .
For Problems 5–8, give the coordinates of each point on the graph of or .
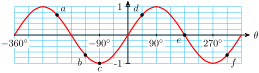
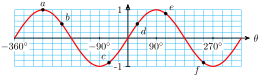
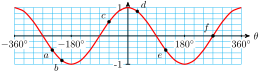
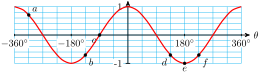
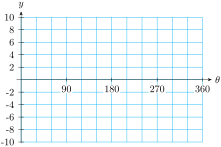
Make a short table of values like the one shown, and sketch the function by hand. Be sure to label the -axis and -axis appropriately.
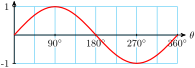
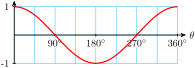
One of these graphs is , and the other is . Explain how you know which is which.
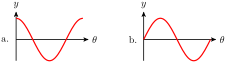
For Problems 11–18, evaluate the expression for and .
, for
, for
, for
, for
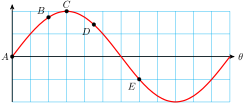
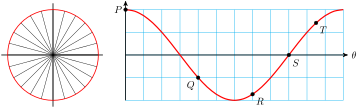
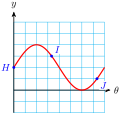
The graph shows your height as a function of angle as you ride the Ferris wheel. For each location – on the Ferris wheel, mark the corresponding point on the graph.
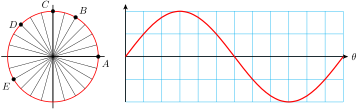
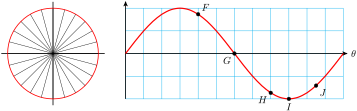
The graph shows your height as a function of angle as you ride the Ferris wheel. For each location – on the graph, mark the corresponding point on the Ferris wheel.
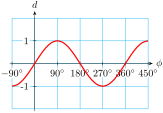
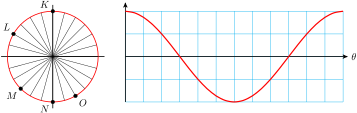
The graph shows the horizontal displacement of your foot from the center of the chain gear as you pedal a bicycle. For each location – on the chain gear, mark the corresponding point on the graph.
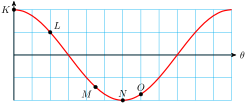
The graph shows the horizontal displacement of your foot from the center of the chain gear as you pedal a bicycle. For each location – on the graph, mark the corresponding point on the chain gear.
- Fill in the table for values of . Round your answers to three decimal places.
- What happens to as increases toward ?
- Fill in the table for values of . Round your answers to three decimal places.
- What happens to as decreases toward ?
- What value does your calculator give for ? Why?
- The calculator gives an error message because is undefined.
- Fill in the table with exact values of . Then give decimal approximations to two places.
(exact) (approx.) - Fill in the table with exact values of . Then give decimal approximations to two places.
(exact) (approx.) - Plot the points from the tables and sketch a graph of .
Write an equation for a sine function with amplitude 6.
Write an equation for a cosine function with amplitude .
Write an equation for a cosine function with midline .
Write an equation for a sine function with midline 2.
Write an equation for a sine function with period .
Write an equation for a cosine function with period .
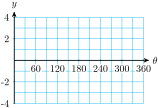
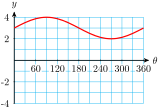
For Problems 31–36,
- Graph the function.
- State the amplitude, period and midline of the function.
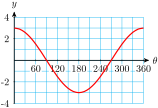
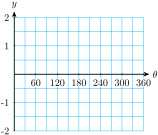
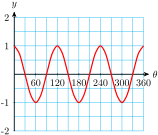
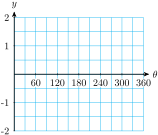
For Problems 37–42, give the coordinates of the points on the graph.
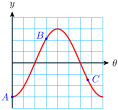
, ,
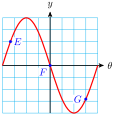
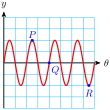
, ,
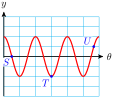
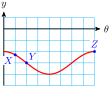
, ,
For Problems 43–48, graph the function using technology. State the amplitude, period, and midline.
amp, period , midline:
amp, period , midline:
amp, period , midline:
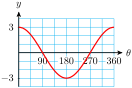
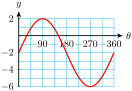
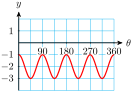
For Problems 49–56,
- State the amplitude, period, and midline for the graph.
- Write an equation for the graph using sine or cosine.
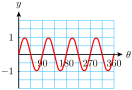
- amp , period , midline:
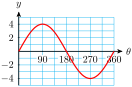
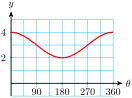
- amp , period , midline:
- amp , period , midline:
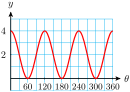
- amp , period , midline:
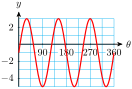
For Problems 57–62, write the equation of a sine or cosine function with the given properties.
Midline , amplitude , period
(Answers vary)
Midline , amplitude , period
Maximum points at and , minimum point at
(Answers vary)
Maximum point at , minimum point at
Horizontal intercepts at and , vertical intercept at
(Answers vary)
Horizontal intercepts at and , vertical intercept at
For Problems 63–66, the table describes a sine or cosine function. Find an equation for the function.
Trigonometry by Katherine Yoshiwara (yoshiwarabooks.org), GNU Free Documentation License 1.2 or later. Adapted for the XYZ HTML edition with the authors' permission (recorded 2026-07-04). License: GFDL-1.2-or-later.