
1.1 Functions and their Representations
Functions as Mappings
Mathematics can be thought of as the study of patterns. In most disciplines, Mathematics is used as a language to express, or codify, relationships between quantities - both algebraically and geometrically - with the ultimate goal of solving real-world problems. The fact that the same algebraic equation which models the growth of bacteria in a petri dish is also used to compute the account balance of a savings account or the potency of radioactive material used in medical treatments speaks to the universal nature of Mathematics. Indeed, Mathematics is more than just about solving a specific problem in a specific situation, it's about abstracting problems and creating universal tools which can be used by a variety of scientists and engineers to solve a variety of problems.
This power of abstraction has a tendency to create a language that is initially intimidating to students. Mathematical definitions are precise and adherence to that precision is often a source of confusion and frustration. It doesn't help matters that more often than not very common words are used in Mathematics with slightly different definitions than is commonly expected. The first `universal tool' we wish to highlight - the concept of a `function' - is a perfect example of this phenomenon in that we redefine a word that already has multiple meanings in English.
The grammar here `from to ' is important. Thinking of a function as a process, we can view the elements of the set as our starting materials, or inputs to the process. The function processes these inputs according to some specified rule and the result is a set of outputs - elements of the set . In terms of inputs and outputs, Definition 1.1 says that a function is a process in which each input is matched to one and only one output.
For example, let's take a look at some of the pets in the Stitz household. Taylor's pets include White Paw and Cooper (both cats), Bingo (a lizard) and Kennie (a turtle). Let be the set of pet names: , and let be the set of pet types: . Let be the process that takes each pet's name as the input and returns that pet's type as the output. Let be the reverse of : that is, takes each pet type as the input and returns the names of the pets of that type as the output. Note that both and are codifying the same given information about Taylor's pets, but one of them is a function and the other is not.
To help identify which process or is a function and why the other is not, we create mapping diagrams for and below. In each case, we organize the inputs in a column on the left and the outputs on a column on the right. We draw an arrow connecting each input to its corresponding output(s). Note that the arrows communicate the grammatical bias: the arrow originates at the input and points to the output.
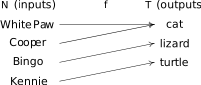
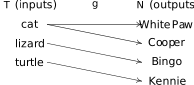
The process is a function since matches each of its inputs (each pet name) to just one output (the pet's type). The fact that different inputs (White Paw and Cooper) are matched to the same output (cat) is fine. On the other hand, matches the input `cat' to the two different outputs `White Paw' and `Cooper', so is not a function. Functions are favored in mathematical circles because they are processes which produce only one answer (output) for any given query (input). In this scenario, for instance, there is only one answer to the question: `What type of pet is White Paw?' but there is more than one answer to the question `Which of Taylor's pets are cats?'
As you might expect, with functions being such an important concept in Mathematics, we need to build a vocabulary to assist us when discussing them. To that end, we have the following definitions.2
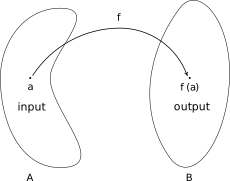
Some remarks about Definition 1.2 are in order. First, and most importantly, the notation `' in Definition 1.2 introduces yet another mathematical use for parentheses. Parentheses are used in some cases as grouping symbols, to represent ordered pairs, and to delineate intervals of real numbers. More often than not, the use of parentheses in expressions like `' is confused with multiplication. As always, paying attention to the context is key. If is a function and `' is in the domain of , then `' is the output from when you input . The diagram below provides a nice generic picture to keep in mind when thinking of a function as a mapping process with input `' and output `'.
In the preceding pet example, the symbol , read ` of Bingo', is asking what type of pet Bingo is, so . The fact that is a function means is unambiguous because matches the name `Bingo' to only one pet type, namely `lizard'. In contrast, if we tried to use the notation `' to indicate what pet name matched to `cat', we have two possibilities, White Paw and Cooper, with no way to determine which one (or both) is indicated.
Continuing to apply Definition 1.2 to our pet example, we find that the domain of the function is , the set of pet names. Finding the range takes a little more work, mostly because it's easy to be caught off guard by the notation used in the definition of `range'. The description of the range as `' is an example of `set-builder' notation. In English, `' reads as `the set of such that is in '. In other words, the range consists of all of the outputs from - all of the values - as varies through each of the elements in the domain . Note that while every element of the set is, by definition, an element of the domain of , not every element of the set is necessarily part of the range of .3
In our pet example, we can obtain the range of by looking at the mapping diagram or by constructing the set which lists all of the outputs from as we run through all of the inputs to . Keep in mind that we list each element of a set only once so the range of is:4
If we let denote a generic element of then is some element in , so we write . In this equation, is called the independent variable and is called the dependent variable.5 Moreover, we say ` is a function of ', or, more specifically, `the type of pet is a function of the pet name' meaning that every pet name corresponds to one, and only one, pet type . Even though and are different things,6 it is very common for the function and its outputs to become more-or-less synonymous, even in what are otherwise precise mathematical definitions.7 We will endeavor to point out such ambiguities as we move through the text.
While the concept of a function is very general in scope, we will be focusing primarily on functions of real numbers because most disciplines use real numbers to quantify data. Our next example explores a function defined using a table of numerical values.
A few remarks about Example 1.1.1 are in order. First, note that , and all work out to be numerically different, and more importantly, all represent different things.8 One of the common mistakes students make is to misinterpret expressions like these, so it's important to pay close attention to the syntax here.
Next, when solving , the variable `' is being used as a convenient `dummy' variable or placeholder in the sense that solving produces the same solutions as solving , , or even . All of these equations are asking for the same thing: what inputs to produce an output of . The choice of the letter `' here makes sense since the inputs are time values. Throughout the text, we will endeavor to use meaningful labels when working in applied situations, but the fact remains that the choice of letters (or symbols) is completely arbitrary.
Finally, given that the range in this example was a finite set of real numbers, we could find the smallest and largest elements of it. Here, they correspond to the coolest and warmest temperatures of the day, respectively, but the meaning would change if the function related different quantities. In many applications involving functions, the end goal is to find the minimum or maximum values of the outputs of those functions (called optimizing the function) so for that reason, we have the following definition.
Definition 1.3 is an example where the name of the function, , is being used almost synonymously with its outputs in that when we speak of `the minimum and maximum of the function ' we are really talking about the minimum and maximum values of the outputs as varies through the domain of . Thus we say that the maximum of is and the minimum of is when referring to the highest and lowest recorded temperatures in the previous example.
Algebraic Representations of Functions
By focusing our attention to functions that involve real numbers, we gain access to all of the structures and tools from prior courses in Algebra. In this subsection, we discuss how to represent functions algebraically using formulas and begin with the following example.
A few remarks about Example 1.1.2 are in order. First, note that and are different expressions. In the former, we are multiplying the input by ; in the latter, we are multiplying the output by . The same goes for , and . The expression calls for adding to the input and then performing the function . The expression has us performing the process first, then adding to the output . Finally, directs us to first find the outputs and and then add the results. As we saw in Example 1.1.1, we see here again the importance paying close attention to syntax.13
Let us return for a moment to the function in Example 1.1.2 which we ultimately represented using the formula . If we introduce the dependent variable , we get the equation , or, more simply . To say that the equation describes as a function of means that for each choice of , the formula determines only one associated -value.
We could turn the tables and ask if the equation describes as a function of . That is, for each value we pick for , does the equation produce only one associated value? One way to proceed is to solve for and get . We see that for each choice of , the expression evaluates to just one number, hence, is a function of . If we give this function a name, say , we have , where in this equation, is the independent variable and is the dependent variable. We explore this idea in the next example.
We'll have more to say about using equations to describe functions in Section 5.5. For now, we turn our attention to a geometric way to represent functions.
Geometric Representations of Functions
In this section, we introduce how to graph functions. As we'll see in this and later sections, visualizing functions geometrically can assist us in both analyzing them and using them to solve associated application problems. Our playground, if you will, for the Geometry in this course is the Cartesian Coordinate Plane. The reader would do well to review Section A.3 as needed.
Our path to the Cartesian Plane requires ordered pairs. In general, we can represent every function as a set of ordered pairs. Indeed, given a function with domain , we can represent . That is, we represent as a set of ordered pairs , or, more generally, . For example, the function which matches Taylor's pet's names to their associated pet type can be represented as:
Moving on, we next consider the function from Example 1.1.1 which relates time to temperature. In this case, . This function has numerical values for both the domain and range so we can identify these ordered pairs with points in the Cartesian Plane. The first coordinates of these points (the abscissae) represent time values so we'll use to label the horizontal axis. Likewise, we'll use to label the vertical axis since the second coordinates of these points (the ordinates) represent temperature values. Note that labeling these axes in this way determines our independent and dependent variable names, and , respectively.
The plot of these points is called `the graph of '. More specifically, we could describe this plot as `the graph of ', because we have decided to name the independent variable . Most specifically, we could describe the plot as `the graph of ', given that we have named the independent variable and the dependent variable .
On the next page we present two plots, both of which are graphs of the function . In both cases, the vertical axis has been scaled in order to save space. In the graph on the left, the same increment on the horizontal axis to measure unit measures units on the vertical axis whereas in the graph on the right, this ratio is . The `' symbol on the vertical axis in the graph on the right is used to indicate a jump in the vertical labeling. Both are perfectly accurate data plots, but they have different visual impacts. Note here that the extrema of , and , correspond to the lowest and highest points on the graph, respectively: , and . More often than not, we will use the graph of a function to help us optimize that function.16
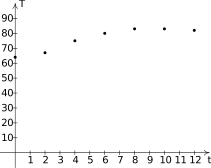
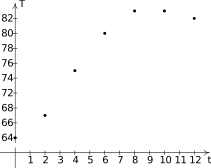
If you found yourself wanting to connect the dots in the graphs above, you're not alone. As it stands, however, the function matches only seven inputs to seven outputs, so those seven points - and just those seven points - comprise the graph of . That being said, common everyday experience tells us that while the data Skippy collected in his table gives some good information about the relationship between time and temperature on a given day, it is by no means a complete description of the relationship.
For example, Skippy's data cannot tell us what the temperature was at 7 a.m. or 12:13 p.m, although we are pretty sure there were outdoor temperatures at those times. Also, given that at some point it was F and later on it was F, it seems reasonable to assume that at some point it was F or even F.
Skippy's temperature function is an example of a discrete function in the sense that each of the data points are `isolated' with measurable gaps in between. The idea of `filling in' those gaps is a quest to find a continuous function to model this same phenomenon.17 We'll return to this example in Sections 1.2 and 1.4 in an attempt to do just that.
In the meantime, our next example involves a function whose domain is (almost) an interval of real numbers and whose graph consists of a (mostly) connected arc.
It cannot be stressed enough that when given a graphical representation of a function, certain assumptions must be made. In the previous example, for all we know, the minimum of the graph is at instead of . If we aren't given an equation or table of data, or if specific points aren't labeled, we really have no way to tell. We also are assuming that the graph depicted in the example, while ultimately made of infinitely many points, has no gaps or holes other than those noted. This allows us to make such bold claims as the existence of a point on the graph with a -coordinate of .
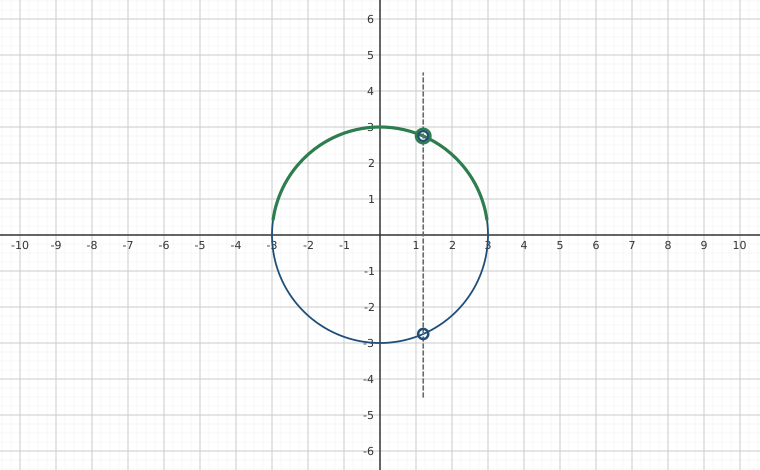
Before moving on to our next example, it is worth noting that the geometric argument made in Example 1.1.4 to establish that is a function of can be generalized to any graph. This result is the celebrated Vertical Line Test and it enables us to detect functions geometrically. Note that the statement of the theorem resorts to the `default' and labels on the horizontal and vertical axes, respectively.
Let's take a minute to discuss the phrase `if and only if' used in Theorem 1.1. The statement `the graph represents as a function of if and only if no vertical line intersects the graph more than once' is actually saying two things. First, it's saying `the graph represents as a function of if no vertical line intersects the graph more than once' and, second, `the graph represents as a function of only if no vertical line intersects the graph more than once'.
Logically, these statements are saying two different things. The first says that if no vertical line crosses the graph more than once, then the graph represents as a function of . But the question remains: could a graph represent as a function of and yet there be a vertical line that intersects the graph more than once? The answer to this is `no' because the second statement says that the only way the graph represents as a function of is the case when no vertical line intersects the graph more than once.
Applying the Vertical Line Test to the graph given in Example 1.1.4, we see below that all of the vertical lines meet the graph at most once (several are shown for illustration) showing is a function of . Notice that some of the lines ( and , for example) don't hit the graph at all. This is fine because the Vertical Line Test is looking for lines that hit the graph more than once. It does not say exactly once so missing the graph altogether is permitted.
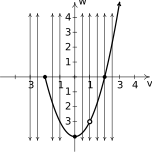
There is also a geometric test to determine if the graph above represents as a function of . We introduce this aptly-named Horizontal Line Test in Exercise and revisit it in Sections 5.5 and 5.6.
Our next example revisits the function from Example 1.1.2 from a graphical perspective.
Our last example of the section uses the interplay between algebraic and graphical representations of a function to solve a real-world problem.
Example 1.1.6 typifies the interplay between Algebra and Geometry which lies ahead. Both the algebraic description of : for , and the graph of were useful in describing aspects of the physical situation at hand. Wherever possible, we'll use the algebraic representations of functions to analytically produce exact answers to certain problems and use the graphical descriptions to check the reasonableness of our answers.
That being said, we'll also encounter problems which we simply cannot answer analytically (such as determining the maximum volume in the previous example), so we will be forced to resort to using technology (specifically graphing technology) in order to find approximate solutions. The most important thing to keep in mind is that while technology may suggest a result, it is ultimately Mathematics that proves it.
We close this section with a summary of the different ways to represent functions.
Ways to Represent a Function
Suppose is a function with domain . Then can be represented:
- verbally; that is, by describing how the inputs are matched with their outputs.
- using a mapping diagram.
- as a set of ordered pairs of the form : .
If is a function whose domain and range are subsets of real numbers, then can be represented:
- algebraically as a formula for .
- graphically by plotting the points in the plane.
Note: An important consequence of the last bulleted item is that the point is on the graph of if and only if
Exercises
In Exercises -, determine whether or not the mapping diagram represents a function. Explain your reasoning. If the mapping does represent a function, state the domain, range, and represent the function as a set of ordered pairs.
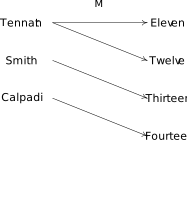
Figure 1.19 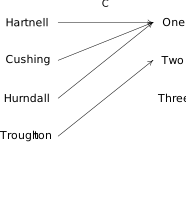
Figure 1.20
In Exercises -, determine whether or not the data in the given table represents as a function of . Explain your reasoning. If the mapping does represent a function, state the domain, range, and represent the function as a set of ordered pairs.
- Suppose is the set of words in the English language and we set up a mapping from into the set of natural numbers as follows: . Explain why this mapping is a function. What would you need to know to determine the range of the function?
- Suppose is the set of last names of all the people who have served or are currently serving as the President of the United States. Consider the mapping from into as follows: . For example, and . Is this mapping a function? What if we use full names instead of just last names? (HINT: Research Grover Cleveland.)
- Under what conditions would the time of day be a function of the outdoor temperature?
For the functions described in Exercises -, find and find and simplify an expression for that takes a real number and performs the following three steps in the order given:
- (1) multiply by 2; (2) add 3; (3) divide by 4.
- (1) add 3; (2) multiply by 2; (3) divide by 4.
- (1) divide by 4; (2) add 3; (3) multiply by 2.
- (1) multiply by 2; (2) add 3; (3) take the square root.
- (1) add 3; (2) multiply by 2; (3) take the square root.
- (1) add 3; (2) take the square root; (3) multiply by 2.
In Exercises -, use the given function to find and simplify the following:
In Exercises -, use the given function to find and simplify the following:
In Exercises -, use the given function to find and solve
In Exercises -, determine whether or not the equation represents as a function of .
Exercises - give a set of points in the -plane. Determine if is a function of . If so, state the domain and range.
- {, , , , , ,
- {( is an odd integer, and is an even integer}
- { is an irrational number}
- The Vertical Line Test is a quick way to determine from a graph if the vertical axis variable is a function of the horizontal axis variable. If we are given a graph and asked to determine if the horizontal axis variable is a function of the vertical axis variable, we can use horizontal lines instead of vertical lines to check. Using Theorem 1.1 as a guide, formulate a `Horizontal Line Test.' (We'll refer back to this exercise in Section 5.6.)
In Exercises -, determine whether or not the graph suggests is a function of . For the ones which do, state the domain and range.
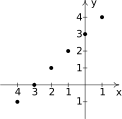
Figure 1.21 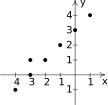
Figure 1.22 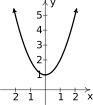
Figure 1.23 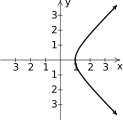
Figure 1.24 - Determine which, if any, of the graphs in numbers - represent as a function of . For the ones which do, state the domain and range. (Feel free to use Exercise.)
In Exercises -, determine whether or not the graph suggests is a function of . For the ones which do, state the domain and range.
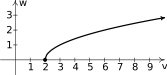
Figure 1.25 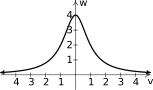
Figure 1.26 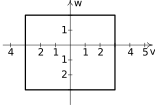
Figure 1.27 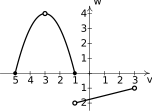
Figure 1.28 - Determine which, if any, of the graphs in numbers - represent as a function of . For the ones which do, state the domain and range. (Feel free to use Exercise.)
In Exercises -, determine whether or not the graph suggests is a function of . For the ones which do, state the domain and range.
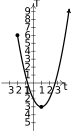
Figure 1.29 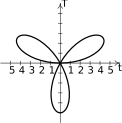
Figure 1.30 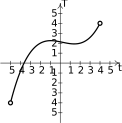
Figure 1.31 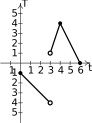
Figure 1.32 - Determine which, if any, of the graphs in numbers - represent as a function of . For the ones which do, state the domain and range. (Feel free to use Exercise.)
In Exercises -, determine whether or not the graph suggests is a function of . For the ones which do, state the domain and range.

Figure 1.33 
Figure 1.34 
Figure 1.35 
Figure 1.36 - Determine which, if any, of the graphs in numbers - represent as a function of . For the ones which do, state the domain and range. (Feel free to use Exercise.)
In Exercises -, determine whether or not the graph suggests is a function of . For the ones which do, state the domain and range.

Figure 1.37 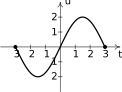
Figure 1.38 
Figure 1.39 
Figure 1.40 - Determine which, if any, of the graphs in numbers - represent as a function of . For the ones which do, state the domain and range. (Feel free to use Exercise.)
In Exercises -, use the graphs of and below to find the indicated values.
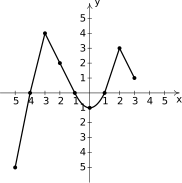
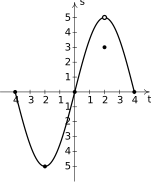
- Solve .
- Solve .
- State the domain and range of .
- State the domain and range of .
In Exercises -, graph each function by making a table, plotting points, and using a graphing utility (if needed.) Use the independent variable as the horizontal axis label and the default `' label for the vertical axis label. State the domain and range of each function.
Consider the function described below:
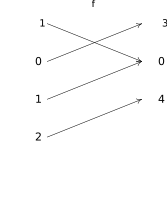
Figure 1.43 - State the domain and range of .
- Find and solve .
- Write as a set of ordered pairs.
- Graph .
Let
- State the domain and range of .
- Create a mapping diagram for .
- Find and solve .
- Graph .
Let . Find and solve .
HINT: Elements of are of the form .
Let . Find and solve .
HINT: Elements of are of the form .
- The area enclosed by a square, in square inches, is a function of the length of one of its sides , when measured in inches. This function is represented by the formula for . Find and solve . Interpret your answers to each. Why is restricted to ?
- The area enclosed by a circle, in square meters, is a function of its radius , when measured in meters. This function is represented by the formula for . Find and solve . Interpret your answers to each. Why is restricted to ?
- The volume enclosed by a cube, in cubic centimeters, is a function of the length of one of its sides , when measured in centimeters. This function is represented by the formula for . Find and solve . Interpret your answers to each. Why is restricted to ?
- The volume enclosed by a sphere, in cubic feet, is a function of the radius of the sphere , when measured in feet. This function is represented by the formula for . Find and solve . Interpret your answers to each. Why is restricted to ?
- The height of an object dropped from the roof of an eight story building is modeled by the function: , . Here, is the height of the object off the ground, in feet, seconds after the object is dropped. Find and solve . Interpret your answers to each. Why is restricted to ?
- The temperature in degrees Fahrenheit hours after 6 AM is given by for . Find and interpret , and .
- The function models the cost, in hundreds of dollars, to produce thousand pens. Find and interpret , and .
- Using data from the Bureau of Transportation Statistics , the average fuel economy in miles per gallon for passenger cars in the US can be modeled by , , where is the number of years since . Use a calculator to find , and . Round your answers to two decimal places and interpret your answers to each.
- The perimeter of a square, in centimeters, is four times the length of one if its sides, also measured in centimeters. Represent the function which takes as its input the length of the side of a square in centimeters, and returns the perimeter of the square in inches, using a formula.
- The circumference of a circle, in feet, is times the diameter of the circle, also measured in feet. Represent the function which takes as its input the length of the diameter of a circle in feet, and returns the circumference of a circle in inches, using a formula.
Suppose gives the amount of money in a retirement account (in dollars) after 30 years as a function of the amount of the monthly payment (in dollars), .
- What does mean?
- What is the significance of the solution to the equation ?.
- Explain what each of the following expressions mean: , , and .
Suppose gives the chance of precipitation (in percent) hours after 8 AM.
- Write an expression which gives the chance of precipitation at noon.
- Write an inequality which determines when the chance of precipitation is more than .
- Explain why the graph in Exercise suggests that not only is as a function of but also is a function of . Suppose and . That is, is the name of the function which takes values as inputs and returns values as outputs and is the name of the function which does vice-versa. Find the domain and range of and compare these to the domain and range of .
- Sketch the graph of a function with domain with range .
Answers
- The mapping is not a function since `Tennant' is matched with both `Eleven' and `Twelve.'
- The mapping is a function since each input is matched with only one output. The domain of is and the range is . We can represent as the following set of ordered pairs:
In this case, is a function of since each is matched with only one .
The domain is and the range is .
As ordered pairs, this function is
- In this case, is not a function of since there are values matched with more than one value. For instance, is matched both to and .
- The mapping is a function since given any word, there is only one answer to `how many letters are in the word?' For the range, we would need to know what the length of the longest word is and whether or not we could find words of all the lengths between (the length of the word `a') and it. See here .
- Since Grover Cleveland was both the 22nd and 24th POTUS, neither mapping described in this exercise is a function.
- The outdoor temperature could never be the same for more than two different times - so, for example, it could always be getting warmer or it could always be getting colder.
- ,
- ,
- ,
- ,
- ,
- ,
For
For
For
For
For
For
For
For
For
For
For
For
- For , and when
- For , and when
- For , and when
- For , and when or
- Function
- Function
- Function
- Not a function
- Function
- Not a function
- Not a function
- Function
- Not a function
- Function
- Not a function
- Function
- Function
- Function
- Not a function
- Function domain = {, , , , , ,} range = {, , , }
- Not a function
- Function domain = range =
- Function domain = range =
- Not a function
- Function domain range
- Function domain range
- Function domain range
- Not a function
- Function domain , range = {}
- Function domain range
- Not a function
- Horizontal Line Test: A graph on the -plane represents as a function of if and only if no horizontal line intersects the graph more than once.
- Function domain = {, , , , , } range = {, , , , , }
- Not a function
- Function domain = range =
- Not a function
Number represents as a function of .
domain = {, , , , , } and range = {, , , , , }
Number represents as a function of .
domain = and range =
- Function domain = range =
- Function domain = range =
- Not a function
- Function domain = range =
- Only number represents as a function of ; domain = and range =
- Function domain = range =
- Not a function
- Function domain = range =
- Function domain = range =
- None of numbers - represent as a function of .
- Function domain = range =
- Function domain = range =
- Function domain = range =
- Function domain = range =
- Only number represents as a function of ; domain = and range =
- Function domain = range =
- Function domain = range =
- Not a function
- Function domain = range =
- Only number represents as a function of ; domain = and range=.
- Domain: , Range: .
- Domain: , Range: .
Domain:
Range:
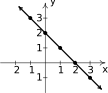
Figure 1.44 Domain:
Range:
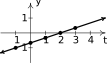
Figure 1.45 Domain:
Range:
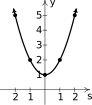
Figure 1.46 Domain:
Range:

Figure 1.47 Domain:
Range:

Figure 1.48 Domain:
Range:
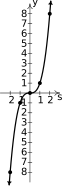
Figure 1.49 Domain:
Range:
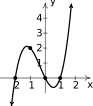
Figure 1.50 Domain:
Range:
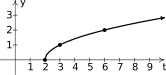
Figure 1.51 Domain:
Range:
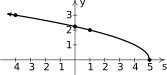
Figure 1.52 Domain:
Range:
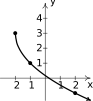
Figure 1.53 Domain:
Range:
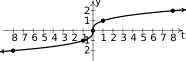
Figure 1.54 Domain:
Range:
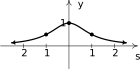
Figure 1.55 - domain , range
- , for .
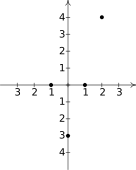
Figure 1.56
- domain , range
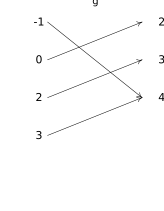
Figure 1.57 - Find and has no solutions.
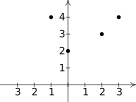
Figure 1.58
- (when ), the solutions to are (when ).
- (when ), the solution to is (when )
- , so the area enclosed by a square with a side of length inches is square inches. The solutions to are . Since is restricted to , we only keep . This means for the area enclosed by the square to be square inches, the length of the side needs to be inches. Since represents a length, .
- , so the area enclosed by a circle with radius meters is square meters. The solutions to are . Since is restricted to , we only keep . This means for the area enclosed by the circle to be square meters, the radius needs to be meters. Since represents a radius (length), .
- , so the volume enclosed by a cube with a side of length centimeters is cubic centimeters. The solution to is . This means for the volume enclosed by the cube to be cubic centimeters, the length of the side needs to centimeters. Since represents a length, .
- , so the volume enclosed by a sphere with radius feet is cubic feet. The solution to is . This means for the volume enclosed by the sphere to be cubic feet, the radius needs to feet. Since represents a radius (length), .
- , so at the moment the object is dropped off the building, the object is feet off of the ground. The solutions to are . Since we restrict , we only keep . This means seconds after the object is dropped off the building, it is feet off the ground. Said differently, the object hits the ground after seconds. The restriction restricts the time to be between the moment the object is released and the moment it hits the ground.
- , so at 6 AM ( hours after 6 AM), it is Fahrenheit. , so at noon ( hours after 6 AM), the temperature is Fahrenheit. , so at 6 PM ( hours after 6 AM), it is Fahrenheit.
- , so to make pens, it costs30 . , so to make pens, it costs . , so to make pens, it costs .
- , so in 1980 ( years after 1980), the average fuel economy of passenger cars in the US was miles per gallon. , so in 1994 ( years after 1980), the average fuel economy of passenger cars in the US was miles per gallon. , so in 2008 ( years after 1980), the average fuel economy of passenger cars in the US was miles per gallon.
- , .
- , .
- The amount in the retirement account after 30 years if the monthly payment is .
- The solution to is what the monthly payment needs to be in order to have in the retirement account after 30 years.
- is how much is in the retirement account in 30 years if is added to the monthly payment . represents the amount of money in the retirement account after 30 years if is invested each month plus an additional . is the sum of money from two retirement accounts after 30 years: one with monthly payment and one with monthly payment .
- Since noon is hours after 8 AM, gives the chance of precipitation at noon.
- We would need to solve or .
- The graph in question passes the horizontal line test meaning for each there is only one . The domain of is (which is the range of ) and the range of is which is the domain of .
- Answers vary.
Adapted from Precalculus with Integrated Calculus, edition 4i, by Carl Stitz and Jeff Zeager (stitz-zeager.com), licensed under CC BY-NC-SA 3.0. Changes were made: reformatted as an accessible XYZ web edition. License: CC-BY-NC-SA-3.0.