
Chapter 6: Continuous Probability Distributions
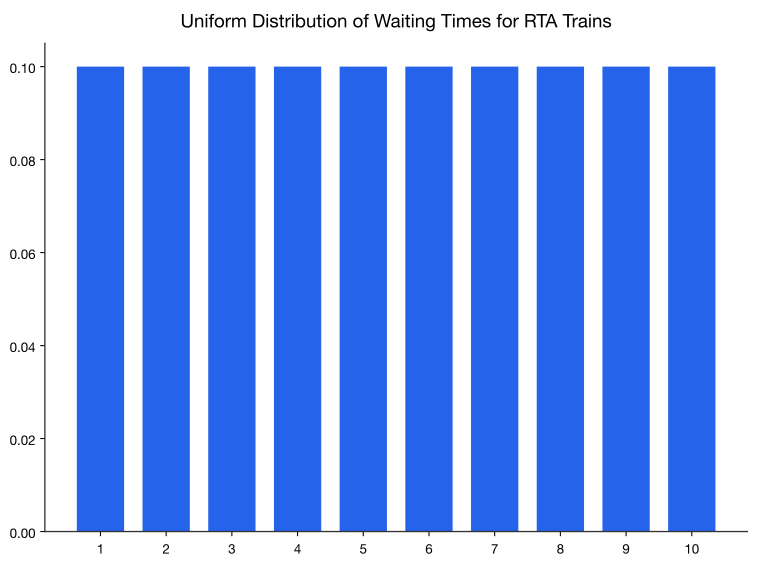
If you have a situation where the probability is always the same, then this is known as a uniform distribution. An example would be waiting for a commuter train. The commuter trains on the Blue and Green Lines for the Regional Transit Authority (RTA) in Cleveland, OH, have a waiting time during peak hours of ten minutes ("2012 annual report," 2012). If you are waiting for a train, you have anywhere from zero minutes to ten minutes to wait. Your probability of having to wait any number of minutes in that interval is the same. This is a uniform distribution. The graph of this distribution is in Figure .
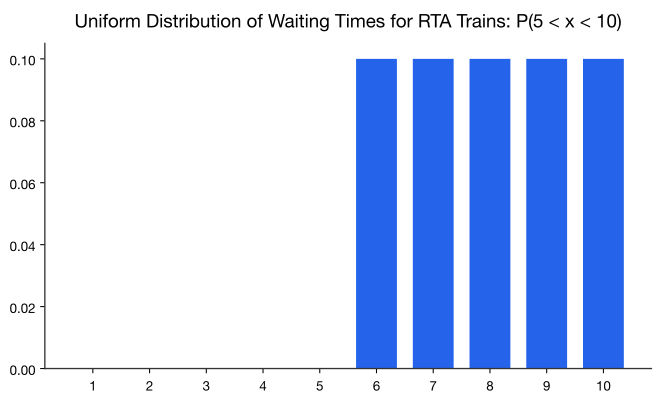
Suppose you want to know the probability that you will have to wait between five and ten minutes for the next train. You can look at the probability graphically such as in Figure .
Adapted from Statistics with Technology, 2nd Edition, by Kathryn Kozak (Coconino Community College), © Kathryn Kozak, licensed under CC BY-SA 4.0. Changes were made. License: CC-BY-SA-4.0.