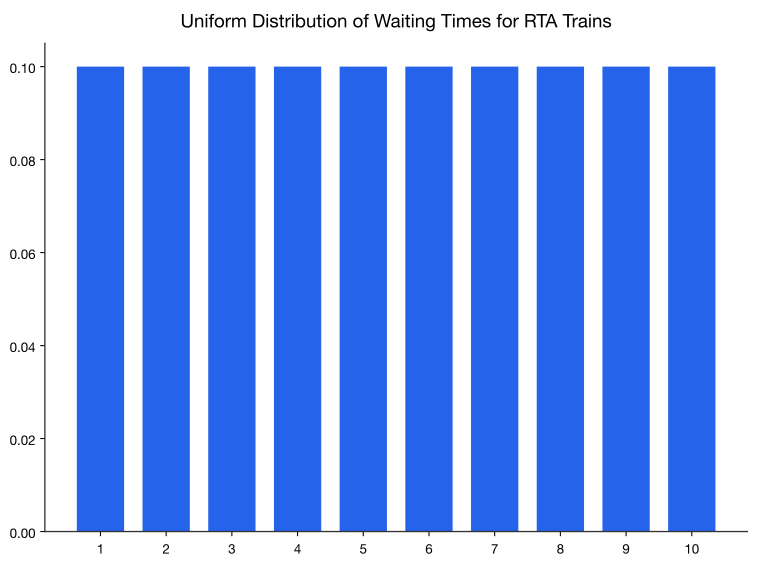
If you have a situation where the probability is always the same, then this is known as a uniform distribution. An example would be waiting for a commuter train. The commuter trains on the Blue and Green Lines for the Regional Transit Authority (RTA) in Cleveland, OH, have a waiting time during peak hours of ten minutes ("2012 annual report," 2012). If you are waiting for a train, you have anywhere from zero minutes to ten minutes to wait. Your probability of having to wait any number of minutes in that interval is the same. This is a uniform distribution. The graph of this distribution is in Figure .
Figure
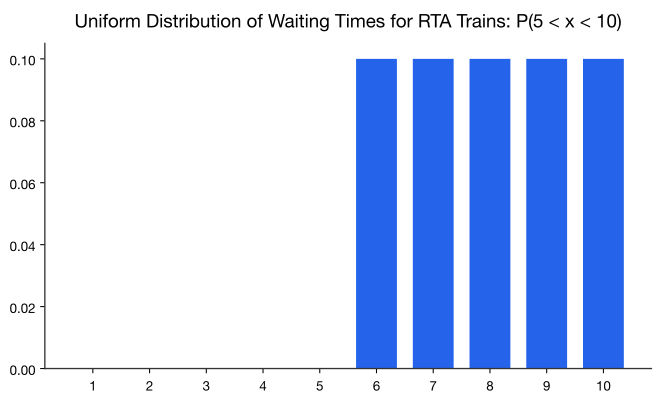
Suppose you want to know the probability that you will have to wait between five and ten minutes for the next train. You can look at the probability graphically such as in Figure .
Figure : Uniform Distribution with P (5<x<10)
How would you find this probability? Calculus says that the probability is the area under the curve. Notice that the shape of the shaded area is a rectangle, and the area of a rectangle is length times width. The length is and the width is 0.1. The probability is , where and x is the waiting time during peak hours.
Notice that in Example d, the probability is equal to one. This is because the probability that was computed is the area under the entire curve. Just like in discrete probability distributions, where the total probability was one, the probability of the entire curve is one. This is the reason that the height of the curve is 0.1. In general, the height of a uniform distribution that ranges between a and b, is .
These eBooks are a prerelease and are not yet certified conformant with WCAG 2.1 AA or ADA Title II. Every page is built against an automated accessibility gate, and the published editions will meet ADA Title II requirements when they release in late September 2026. If something is unusable, please tell us.