This section focuses on measures of central tendency. Many times you are asking what to expect on average. Such as when you pick a major, you would probably ask how much you expect to earn in that field. If you are thinking of relocating to a new town, you might ask how much you can expect to pay for housing. If you are planting vegetables in the spring, you might want to know how long it will be until you can harvest. These questions, and many more, can be answered by knowing the center of the data set. There are three measures of the “center” of the data. They are the mode, median, and mean. Any of the values can be referred to as the “average.”
The mode is the data value that occurs the most frequently in the data. To find it, you count how often each data value occurs, and then determine which data value occurs most often.
The median is the data value in the middle of a sorted list of data. To find it, you put the data in order, and then determine which data value is in the middle of the data set.
The mean is the arithmetic average of the numbers. This is the center that most people call the average, though all three – mean, median, and mode – really are averages.
There are no symbols for the mode and the median, but the mean is used a great deal, and statisticians gave it a symbol. There are actually two symbols, one for the population parameter and one for the sample statistic. In most cases you cannot find the population parameter, so you use the sample statistic to estimate the population parameter.
The value for is used to estimate since can't be calculated in most situations.
A data set can have more than one mode. If there is a tie between two values for the most number of times then both values are the mode and the data is called bimodal (two modes). If every data point occurs the same number of times, there is no mode. If there are more than two numbers that appear the most times, then usually there is no mode.
In Example , there were an odd number of data points. In that case, the median was just the middle number. What happens if there is an even number of data points? What would you do?
An outlier is a data value that is very different from the rest of the data. It can be really high or really low. Extreme values may be an outlier if the extreme value is far enough from the center. In Example , the data value 22.1 pounds is an extreme value and it may be an outlier.
If there are extreme values in the data, the median is a better measure of the center than the mean. If there are no extreme values, the mean and the median will be similar so most people use the mean.
The mean is not a resistant measure because it is affected by extreme values. The median and the mode are resistant measures because they are not affected by extreme values.
As a consumer you need to be aware that people choose the measure of center that best supports their claim. When you read an article in the newspaper and it talks about the “average” it usually means the mean but sometimes it refers to the median. Some articles will use the word “median” instead of “average” to be more specific. If you need to make an important decision and the information says “average”, it would be wise to ask if the “average” is the mean or the median before you decide.
As an example, suppose that a company wants to use the mean salary as the average salary for the company. This is because the high salaries of the administration will pull the mean higher. The company can say that the employees are paid well because the average is high. However, the employees want to use the median since it discounts the extreme values of the administration and will give a lower value of the average. This will make the salaries seem lower and that a raise is in order.
Why use the mean instead of the median? The reason is because when multiple samples are taken from the same population, the sample means tend to be more consistent than other measures of the center. The sample mean is the more reliable measure of center.
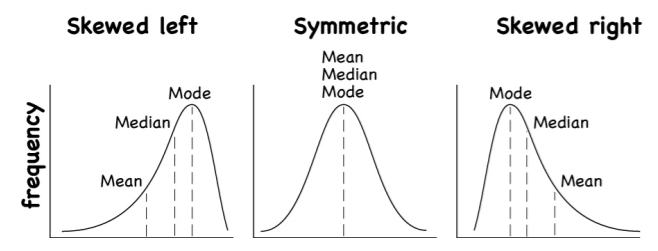
To understand how the different measures of center related to skewed or symmetric distributions, see Figure . As you can see sometimes the mean is smaller than the median and mode, sometimes the mean is larger than the median and mode, and sometimes they are the same values.
Figure : Mean, Median, Mode as Related to a Distribution
One last type of average is a weighted average. Weighted averages are used quite often in real life. Some teachers use them in calculating your grade in the course, or your grade on a project. Some employers use them in employee evaluations. The idea is that some activities are more important than others. As an example, a fulltime teacher at a community college may be evaluated on their service to the college, their service to the community, whether their paperwork is turned in on time, and their teaching. However, teaching is much more important than whether their paperwork is turned in on time. When the evaluation is completed, more weight needs to be given to the teaching and less to the paperwork. This is a weighted average.
You can find a weighted average using technology. The last thing to mention is which average is used on which type of data.
Mode can be found on nominal, ordinal, interval, and ratio data, since the mode is just the data value that occurs most often. You are just counting the data values. Median can be found on ordinal, interval, and ratio data, since you need to put the data in order. As long as there is order to the data you can find the median. Mean can be found on interval and ratio data, since you must have numbers to add together.
These eBooks are a prerelease and are not yet certified conformant with WCAG 2.1 AA or ADA Title II. Every page is built against an automated accessibility gate, and the published editions will meet ADA Title II requirements when they release in late September 2026. If something is unusable, please tell us.