
11.4 Hierarchical Model Example - Kruschke BEST Test
A comparison between means is a standard statistical technique. However, using a hierarchical model can be superior to the typical tests.
In this example, we use the Kruschke BEST Test to compare the difference between a treatment and control - we want to obtain the best estimate of the difference between the means of variables. With the MCMC technique, we can achieve it with the following,
from sie import *drug = (101,100,102,104,102,97,105,105,98,
101,100,123,105,103,100,95,102,106,
109,102,82,102,100,102,102,101,102,
102,103,103,97,97,103,101,97,104,
96,103,124,101,101,100,101,101,104,
100,101)
placebo = (99,101,100,101,102,100,97,101,
104,101,102,102,100,105,88,101,100,
104,100,100,100,101,102,103,97,101,
101,100,101,99,101,100,100,
101,100,99,101,100,102,99,100,99)
model=mcmc.BESTModel(drug,placebo)model.run_mcmc()Show expected output
Running MCMC...
Done.
5.80 smodel.namesShow expected output
['mu1', 'mu2', 'sigma1', 'sigma2', 'nu']model.plot_chains('mu1')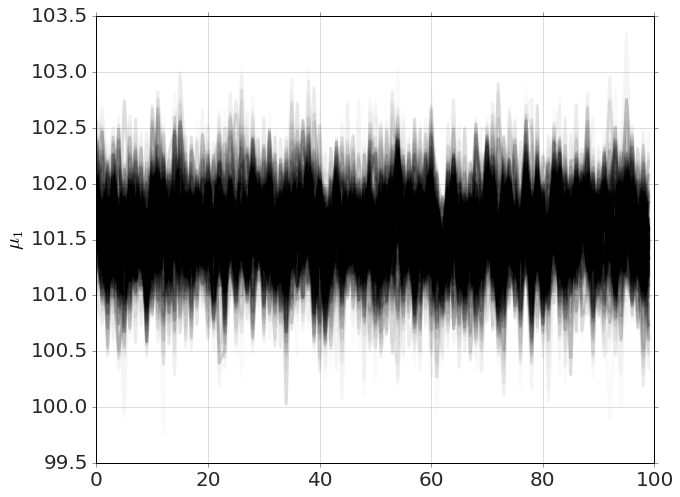
drug group.model.plot_distribution('mu1')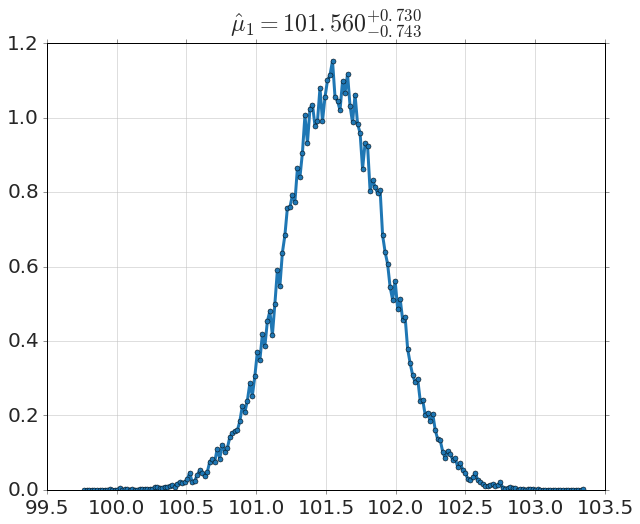
drug group.model.plot_distribution('mu2')model.plot_distribution(r'$\delta$=mu1-mu2')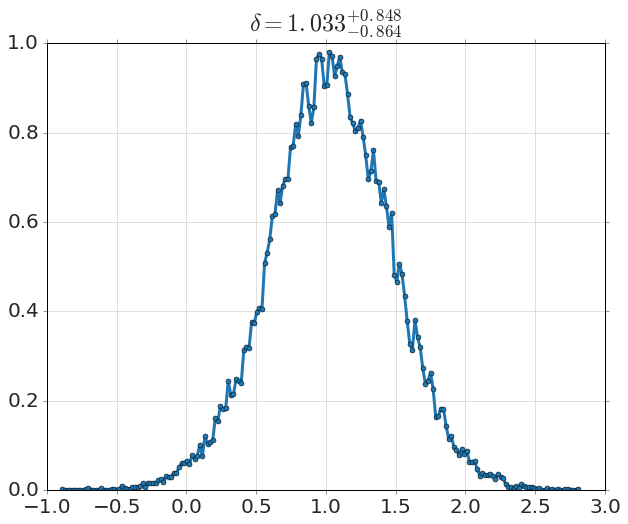
drug group and the placebo group.We can clearly see from the distribution of , as well as the credible ranges, that there is significant evidence for a non-zero effect. We would want to extend this to include the effect size, and explore the prior probability of the the drug working, in order to reasonably assess whether this is an effect worth pursuing.
Adapted from Statistical Inference for Everyone, by Brian Blais (Bryant University), licensed under CC BY-SA 4.0 (dual-licensed under the GNU FDL 1.2 or later; this adaptation uses the CC BY-SA grant). Changes were made; this adaptation is distributed under the same license. License: CC-BY-SA-4.0.