
7.6 Computer Examples
from sie import *Estimating Lengths
Known deviation,
x=[5.1, 4.9, 4.7, 4.9, 5.0]
sigma=0.5
mu=sample_mean(x)
N=len(x)dist=normal(mu,sigma/sqrt(N))
distplot(dist)Show expected output
<matplotlib.figure.Figure at 0x10713c710>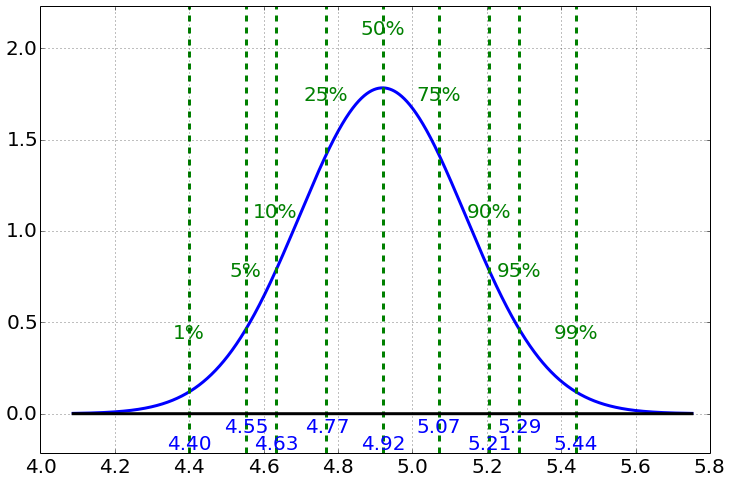
credible_interval(dist)Show expected output
(4.4817387297117088, 4.9199999999999999, 5.358261270288291)Unknown
mu=sample_mean(x)
s=sample_deviation(x)
print mu,s
Show expected output
4.92 0.148323969742dist=tdist(N-1,mu,s/sqrt(N))distplot(dist,xlim=[4.6,5.4])Show expected output
<matplotlib.figure.Figure at 0x1085b5c50>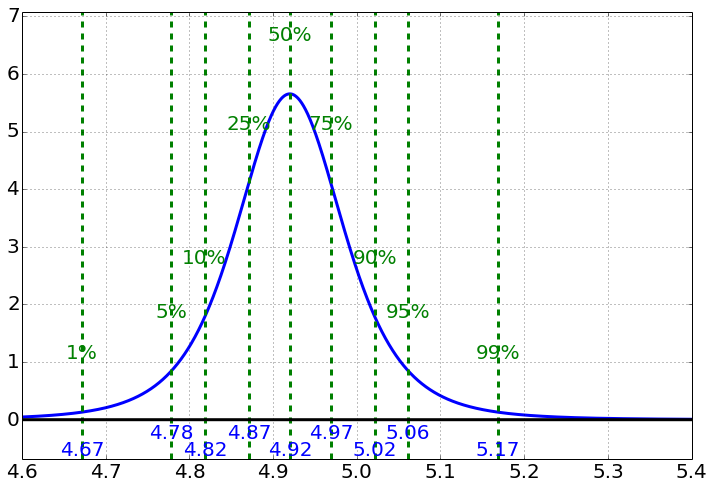
credible_interval(dist)Show expected output
(4.7358314667008017, 4.9199999999999999, 5.1041685332991982)Adapted from Statistical Inference for Everyone, by Brian Blais (Bryant University), licensed under CC BY-SA 4.0 (dual-licensed under the GNU FDL 1.2 or later; this adaptation uses the CC BY-SA grant). Changes were made; this adaptation is distributed under the same license. License: CC-BY-SA-4.0.