

Chapter 7 Review
In chapter 7, we looked at linear relationships between two variables. We saw that we make ordered pairs by labeling one variable as the “x” coordinate and one variable as the “y” coordinate. We learned that we can plot all of these ordered pairs on the “Rectangular Coordinate System”. The x and y-axis break the rectangular coordinate system into 4 quadrants. When we plot many ordered pairs in a situation, a “scatterplot” is created.
Sometimes variables like time and cost have a linear relationship. When the points lie exactly on a nonvertical line, any two distinct points determine its slope “m” (average rate of change) and y-intercept (0, b). When a scatterplot only approximately follows a line, a line through two points is an approximation rather than an exact fit to every point. For the exact nonvertical case, we can find these values and use these to find the “Equation of the line” y = mx + b. Here are the formulas for slope and y-intercept between the ordered pairs and .
(Slope)
(Y – intercept)
Remember the slope “m” is also called the average rate of change. In fact it is the change in the y-variable divided by the change in the x-variable. The average rate of change is a very important number in analyzing general trends in business and other applications.
Remember the y-intercept “b” actually is the ordered pair (0, b). It is in fact the place where the line crosses the y-axis. It always has an x-coordinate of 0. In fact the y-intercept is often the initial value in a linear relationship. In cost data for example, the y-intercept is the initial costs to set up the business.
Plugging in the “m” and the “b” into y = m x + b will give the equation of the line. This equation can be used as a formula to help predict y-values for a given x-value.
We also looked at a system of two linear equations. The solution to a linear system is the ordered pair where the two lines cross. If the lines do not cross at all, there is no solution to the linear system. If the two lines turn out to be the same line, then all points on the line are solutions. A linear system can be solved by graphing or by algebraic methods like the substitution method.
To solve a system by graphing, simply graph both lines and see if you can determine the ordered pair where the two lines cross.
To solve a system by substitution, solve for one of the variables (x or y) in either equation. Then plug in the expression for that variable into the other equation you have not used yet. This substitution will eliminate one of the variables and allow you to solve the remaining equation for x or y. After you have found x or y, plug the number back into any equation and find the other variable.
Review Problems Chapter 7
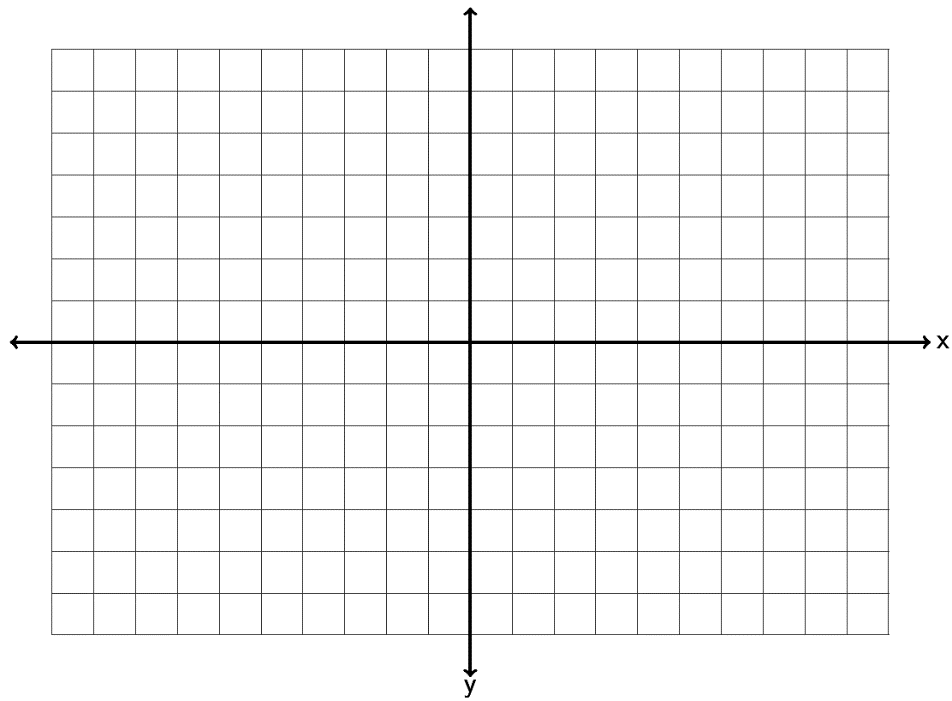
Graph the ordered pairs (-5, -2), (2,0), (-4, 2), (0, -3), (1, -3) on the graph provided. Which point is an x-intercept? Which point is a y-intercept? For the other three points, give the quadrant they lie in.
Check answer
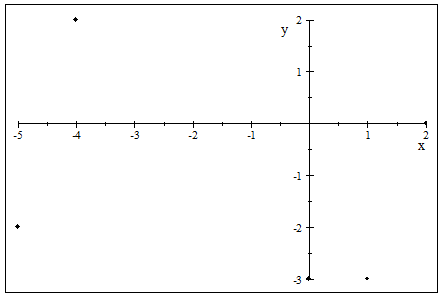
Point (2,0) is an x-intercept, (0,-3) is a y – intercept. The other points lie in these quadrants: (-5,-2), III; (-4,2), II; (1,-3), IV.
Graph the ordered pairs (-1, 6), (0,-5), (-2, -8), (-2, 0), (4, 5) on the graph provided. Which point is an x-intercept? Which point is a y-intercept? For the other three points, give the quadrant they lie in.
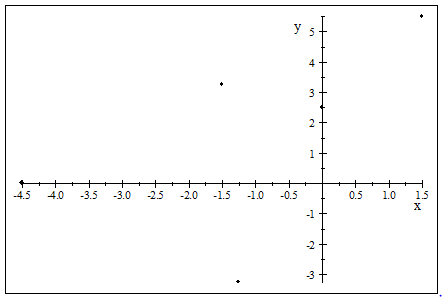
Graph the ordered pairs (1.5, 5.5), (0, 2.5), (-1.25, -3.25), (-4.5, 0), on the graph provided. Which point is an x-intercept? Which point is a y-intercept? For the other three points, give the quadrant they lie in.
Check answer
Point (-4.5,0) is an x-intercept, (0,2.5) is a y – intercept. The other points lie in these quadrants: (1.5,5.5), I; (-1.25,-3.25), III; (-1.5,3.25), II.
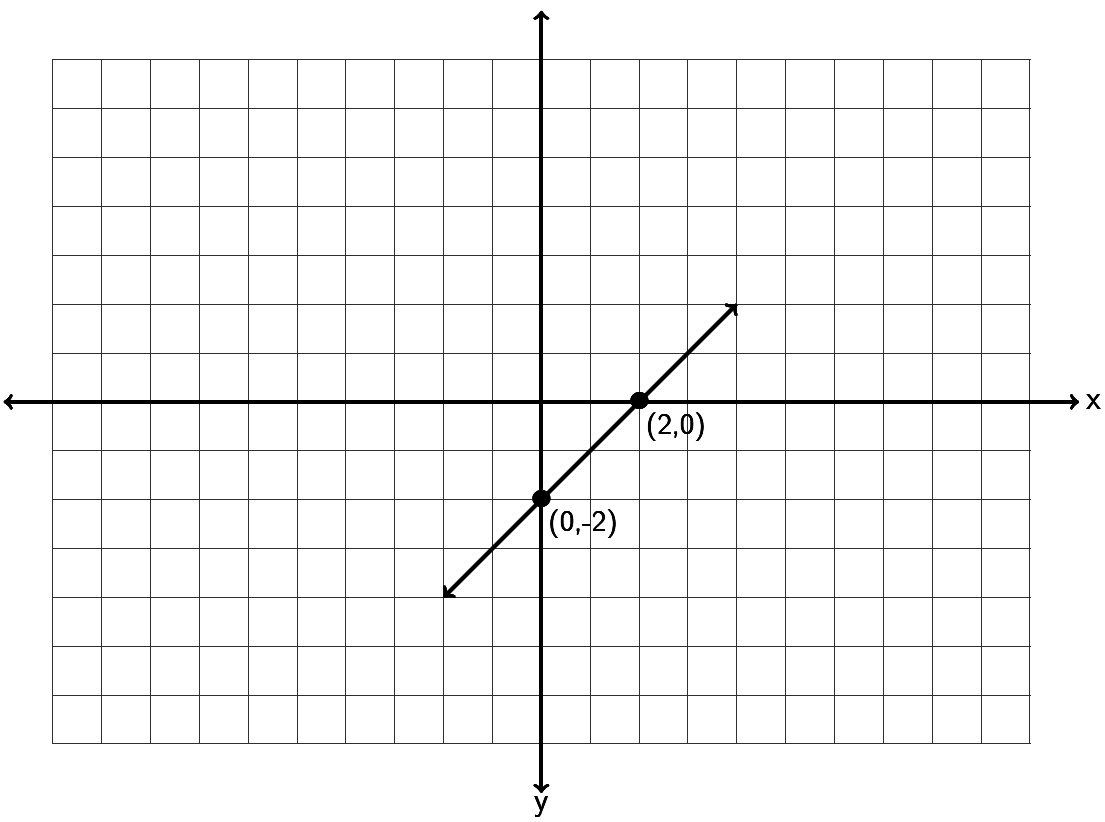
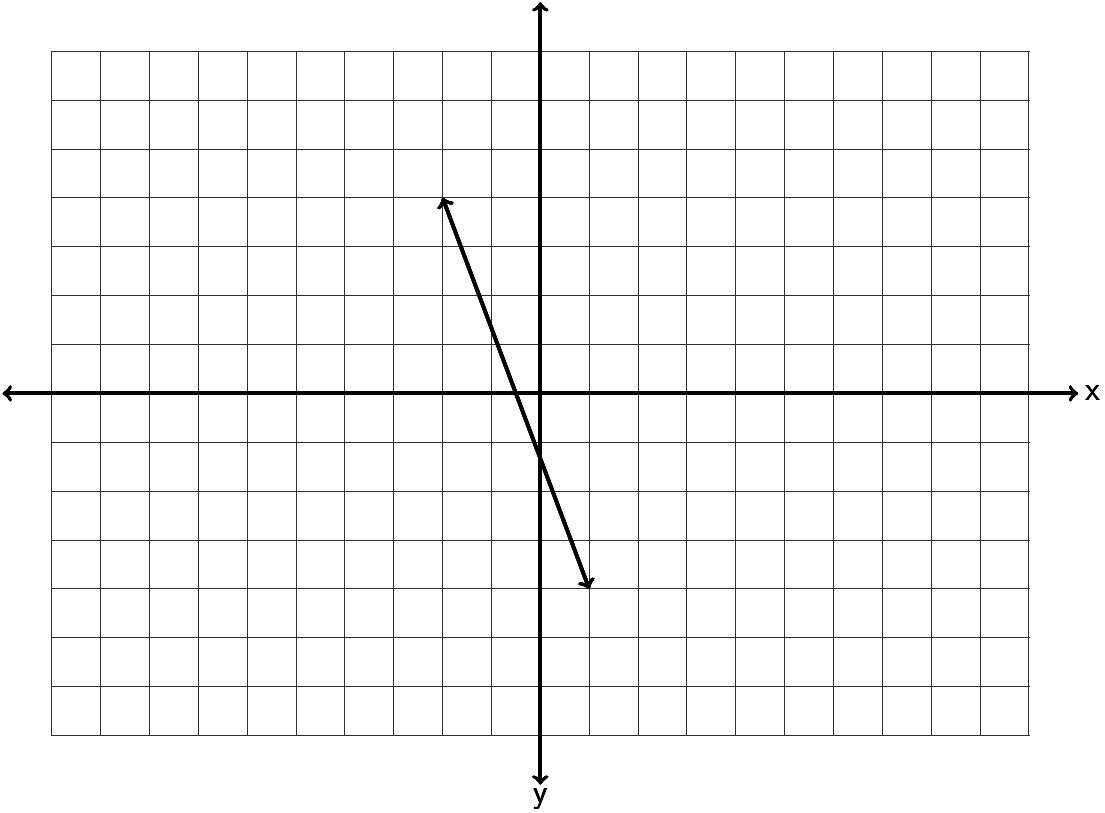
Find the slope of the following line by finding the vertical and horizontal change. Be sure to write your answer in lowest terms.
For this exercise, moving 3 units to the right along the illustrated line changes y by -8 units. Find its slope from this horizontal and vertical change. Be sure to write your answer in lowest terms.
Check answer
Find the slope of the following line by finding the vertical and horizontal change. Be sure to write your answer in lowest terms.
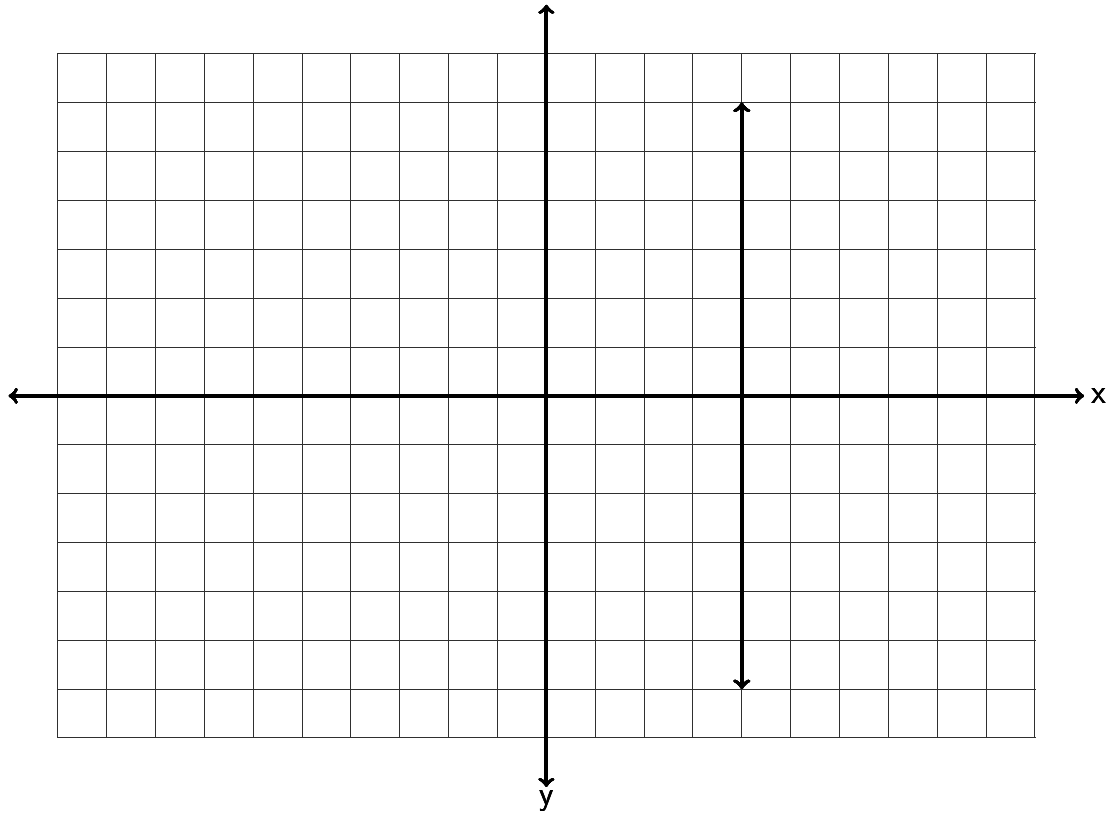
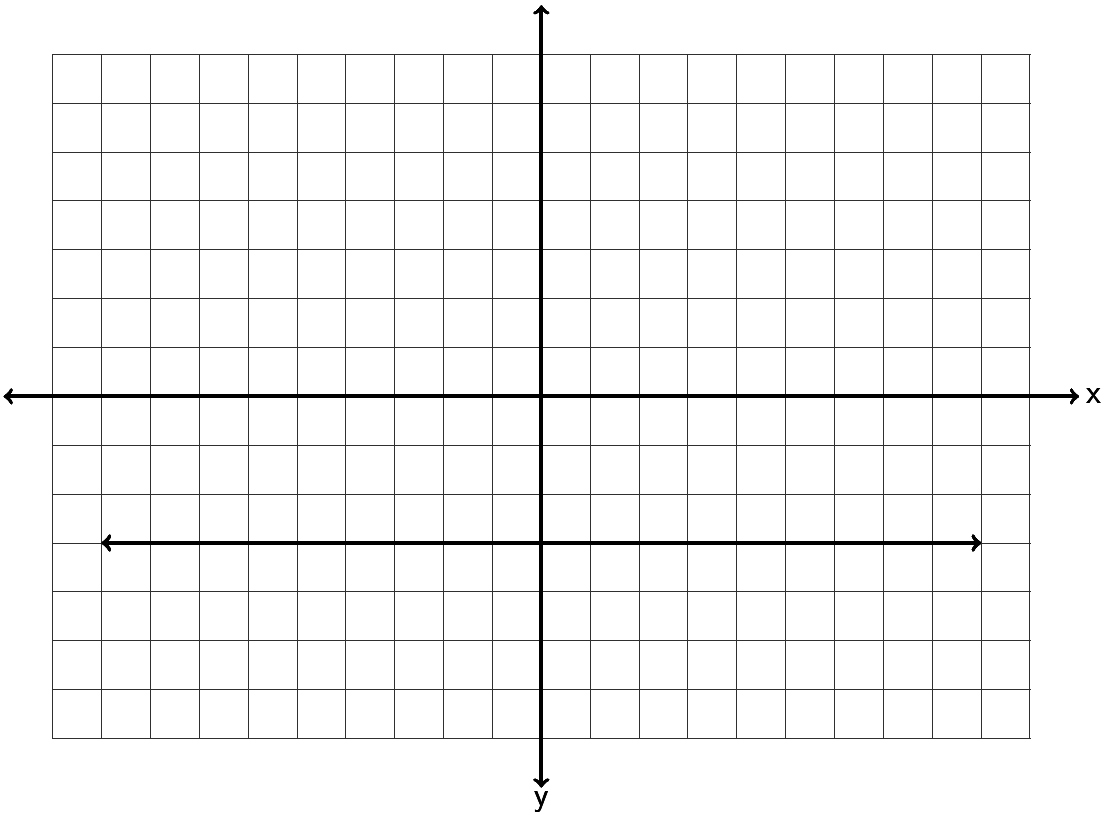
Find the slope of the following line by finding the vertical and horizontal change. Be sure to write your answer in lowest terms.
Check answer
Draw a line that goes through the point (-3, -2) and has a slope of .
Draw a line that goes through the point (2, 1) and has a slope of .
Check answer
Draw a line that goes through the point (-5, 3) and has an undefined slope.
Draw a line that goes through the point ( -2, 4) and has a slope = 0.
Check answer
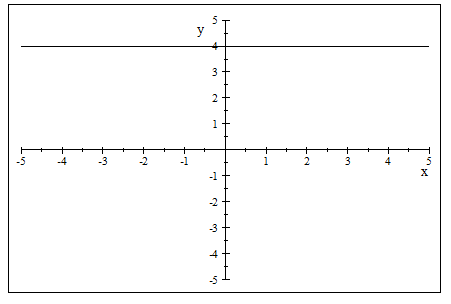
Graph the line -1x +4y = -4 by finding the x and y-intercepts.
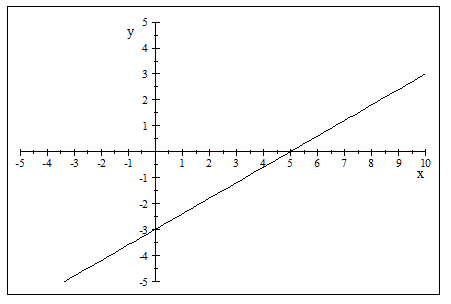
Graph the line 3x - 5y = 15 by finding the x and y-intercepts.
Check answer
Use the slope formula to find the slope of the line between . Be sure to simplify your answer and write it in lowest terms.
Use the slope formula to find the slope of the line between . Be sure to simplify your answer and write it in lowest terms.
Check answer
Use the slope formula to find the slope of the line between Be sure to simplify your answer and write it in lowest terms.
Use the slope formula to find the slope of the line between . Be sure to simplify your answer and write it in lowest terms.
Check answer
Use the slope formula to find the slope of the line between . Be sure to simplify your answer and write it in lowest terms.
A line has a slope of +3/5. What is the slope of a line parallel to it? What is the slope of a line perpendicular to it?
Check answer
A line has a slope of . What is the slope of a line parallel to it? What is the slope of a line perpendicular to it?
When a hot dog stand makes 50 hot dogs, the profit for that day is $92. When the hot dog stand makes 45 hot dogs, the profit for that day is $82.80. Write two ordered pairs with x being the number of hot dogs made and y being profit. What is the average rate of change in profit per hot dog? (Write your answer as a decimal.)
Check answer
The longer an employee works at a coffee company, the higher his or her salary is. Let’s explore the relationship between years worked (x) and salary in thousands of dollars (y). A person that has worked three years for the company makes an annual salary of 32 thousand dollars. A person that has worked seven years for the company makes an annual salary of 34 thousand dollars. Write two ordered pairs and find the average rate of change in salary in thousands per year worked.
Graph a line with a y-intercept of ( 0, 2) and a slope of . What is the equation of the line you drew in slope-intercept form?
Check answer
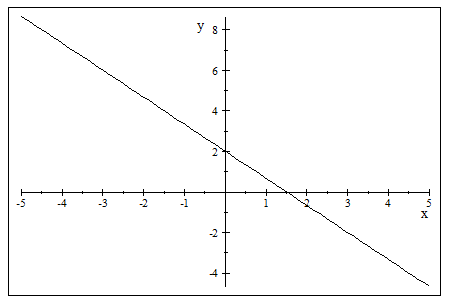
Graph a line with a y-intercept of ( 0, -4) and a slope of . What is the equation of the line you drew in slope-intercept form?
Graph a line with a y-intercept of ( 0, 5) and a slope of . What is the equation of the line you drew in slope-intercept form?
Check answer
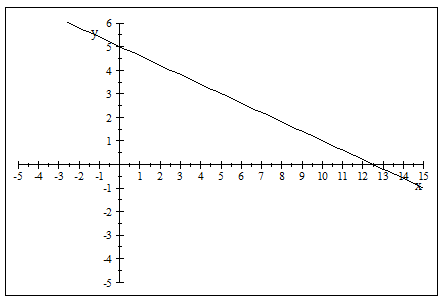
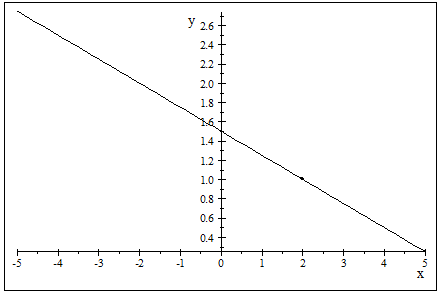
For this exercise, moving 4 units to the right along the illustrated line changes y by 1 unit. Find its equation in slope-intercept form using this slope and the labeled intercept. Remember, you will need to find the slope m and the y intercept (0,b) first.
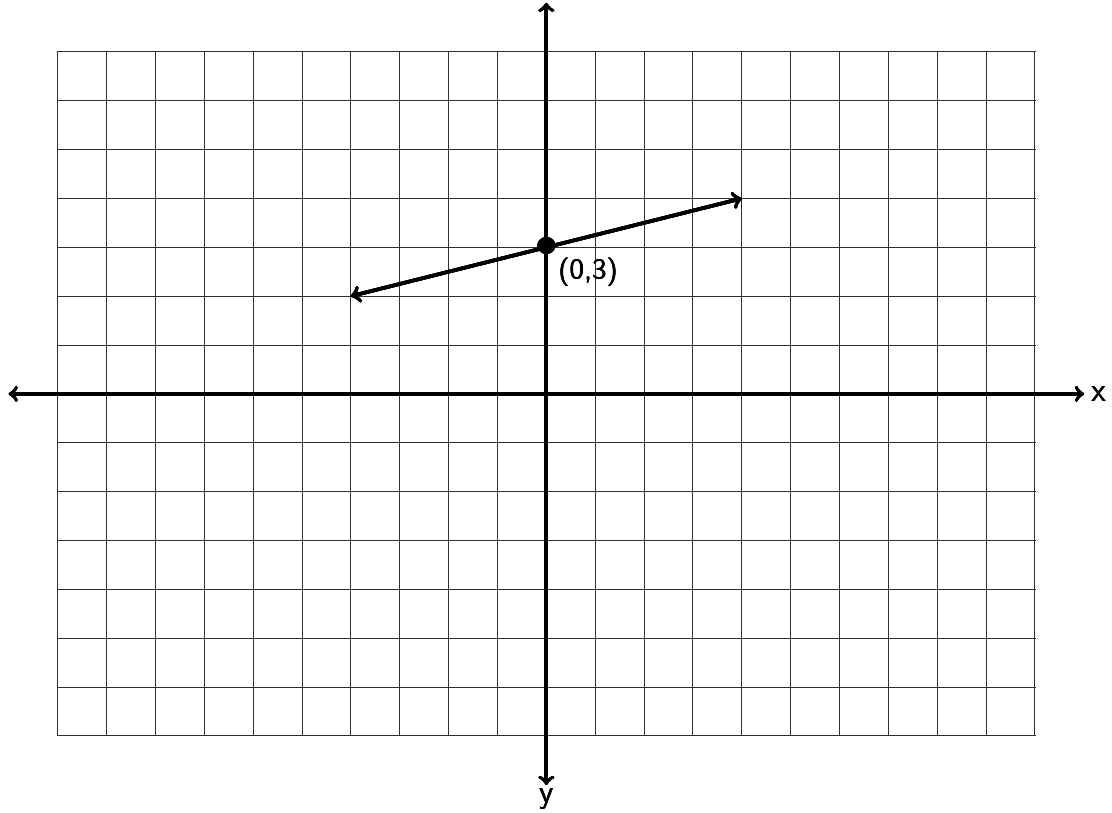
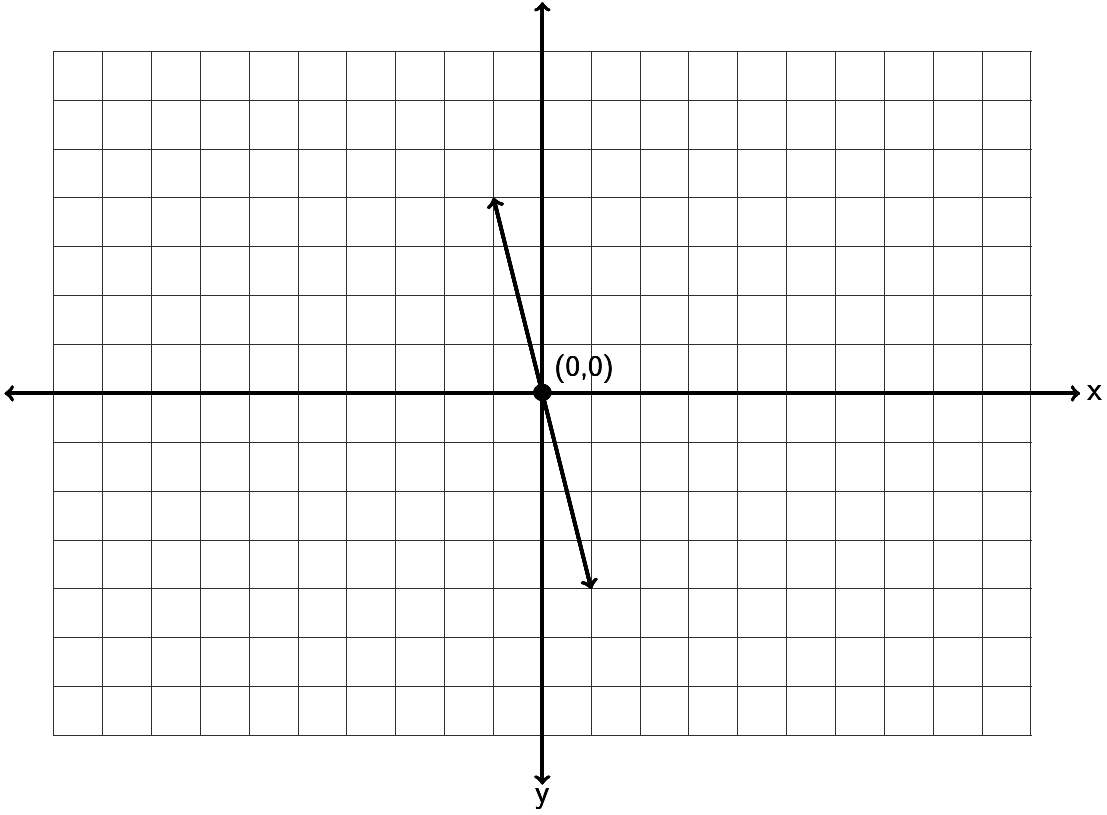
For this exercise, moving 1 unit to the right along the illustrated line changes y by -4 units. Find its equation in slope-intercept form using this slope and the labeled intercept. Remember, you will need to find the slope m and the y-intercept (0,b) first.
Check answer
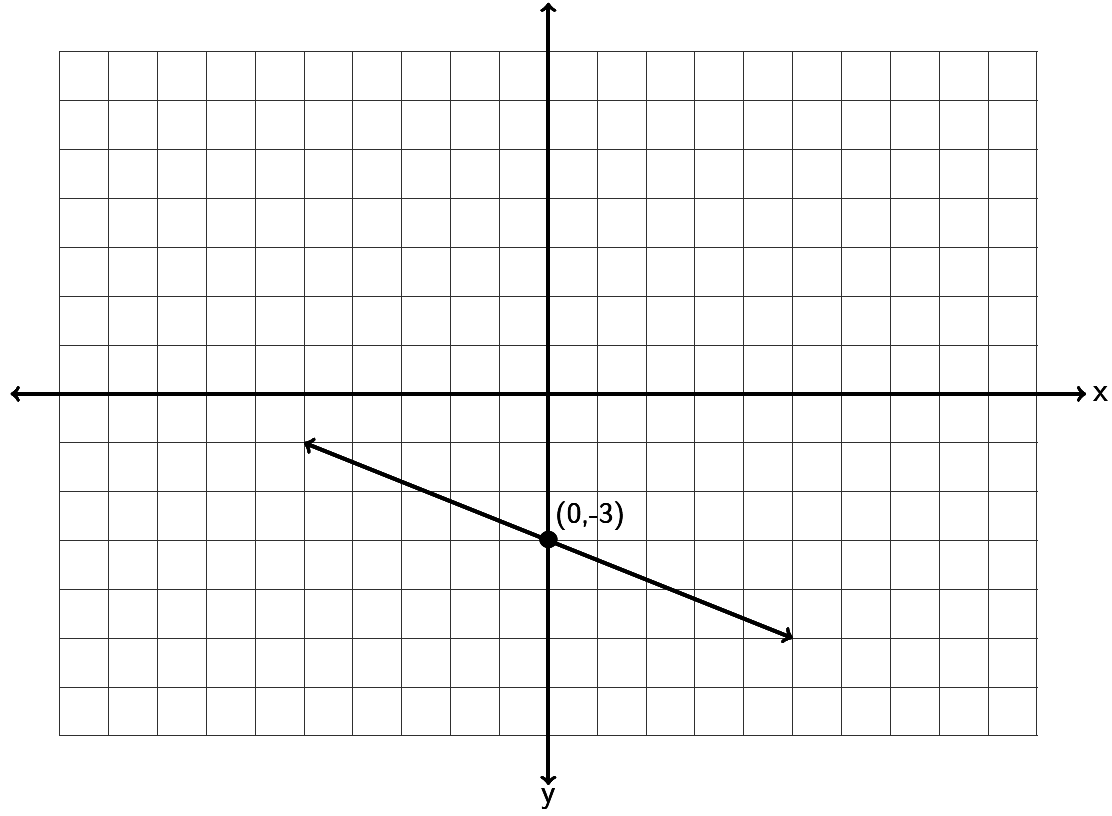
For this exercise, moving 5 units to the right along the illustrated line changes y by -2 units. Find its equation in slope-intercept form using this slope and the labeled intercept. Remember, you will need to find the slope m and the y-intercept (0,b) first.
Find the equation of a line with a slope of and passing through the point .
Check answer
Find the equation of a line with a slope of and passing through the point .
Find the equation of a line with a slope of and passing through the point .
Check answer
Find the equation of a line through the points and .
Find the equation of a line through the points and .
Check answer
Find the equation of a line through the points and .
Find the equation of a line perpendicular to and passing through the point .
Check answer
Find the equation of a line parallel to and passing through the point .
Find the equation of a vertical line that goes through the point .
Check answer
Find the equation of a horizontal line that goes through the point .
Find the equation of a line with zero slope that goes through the point .
Check answer
Find the equation of a line with undefined slope that goes through the point .
Find the equation of a line parallel to the y axis that goes through .
Check answer
Find the equation of a line perpendicular to the y axis that goes through .
- A company that makes metal car components looked at their average profit in month 2 to be $32,000 and the average profit in month 7 to be $33,000. Write two ordered pairs of the form (month, profit). Use the two ordered pairs to find the equation of a line that could be used to estimate the company’s average profits (y) if we knew the month (x).
- What does the slope of the line tell us?
- What does the y-intercept of the line tell us?
- Use your equation in part (a) to predict the profit in month 13.
Check answer
(a) ; (b) ;
For every month, the company’s profit is predicted to increase, on average, by $200.
(c) ;
In month zero, the company is predicted to make a profit of $31,600
(d) $34,200
- A horse that weighs 1100 pounds can carry about 230 pounds. A horse that weighs 1400 pounds can carry about 290 pounds. Write two ordered pairs of the form (weight of horse, pounds horse can carry). Use the two ordered pairs to find the equation of a line that we could use to predict the number of pounds a horse can carry (y) if we knew the weight of the horse (x).
- What does the slope of the line tell us?
- Use your equation in part (a) to predict how much a horse weighing 1300 pounds can carry?
The following linear systems have been written in slope-intercept form. Solve the following linear systems by inspection. (Hint: Examine the slope and y-intercepts.) You do not have to do any work for these. Just give the solution to the system.
Check answer
Infinitely many solutions. (Dependent)
Check answer
Solve the following linear system by graphing both lines. You must graph both lines and give the solution to the system.
Solve the following linear systems by graphing both lines. You must graph both lines and give the solution to the system.
Check answer
Infinitely many solutions. (Dependent)
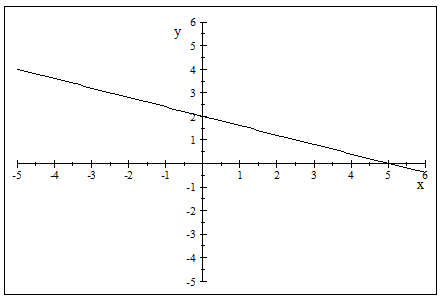
Solve each of the following linear systems by using the substitution method.
Check answer
Check answer
No solution. (Inconsistent)
Adapted from Preparing for Algebra and Statistics, Third Edition, by Matt Teachout. License: CC BY 4.0. Copyright and sources.