

7A Rectangular Coordinate System and Scatterplots
7A Rectangular Coordinate System and Scatterplots
Read the transcriptDownload the videoNarration credits and licences
Look at the following data which gives the profits of a small cupcake shop over the last twelve months. This is a good example of a relationship between two variables. In this case it is time and profit.
| Month | Profit in Thousands of Dollars |
|---|---|
| 1 | 1.5 |
| 2 | 1.8 |
| 3 | 1.9 |
| 4 | 2.2 |
| 5 | 2.4 |
| 6 | 2.7 |
| 7 | 2.8 |
| 8 | 3.0 |
| 9 | 3.1 |
| 10 | 3.4 |
| 11 | 3.5 |
| 12 | 3.8 |
It is important to be able to graph the data so that we can see if there are any trends. The main graph we use in Statistics is a scatterplot. To make a scatterplot we need to review plotting ordered pairs.
In the time/profit data above, we like to choose one variable to be the x-variable and one to be the y-variable. If we chose time as x and profit as y, we would be able to represent this data as ordered pairs.
Ordered pairs have the form (x, y). So for example the profit was 2.8 thousand dollars in the 7th month so that would correspond to an ordered pair of (7, 2.8). A scatterplot is just a graph of all the ordered pairs.
How do we plot an ordered pair? We need to use the Rectangular Coordinate System. If you remember from previous classes, the horizontal axis is called the x-axis and the vertical axis is called the y-axis. The two axes divide the region into four quadrants. Where the x-axis and y-axis meet is the ordered pair ( 0, 0 ) and is called the origin. Notice the x-axis and y-axis are just like the number line. Numbers to the right of the origin on the x-axis are positive and numbers to the left of the origin are negative. Numbers above the origin on the y-axis are positive and numbers below the origin are negative.
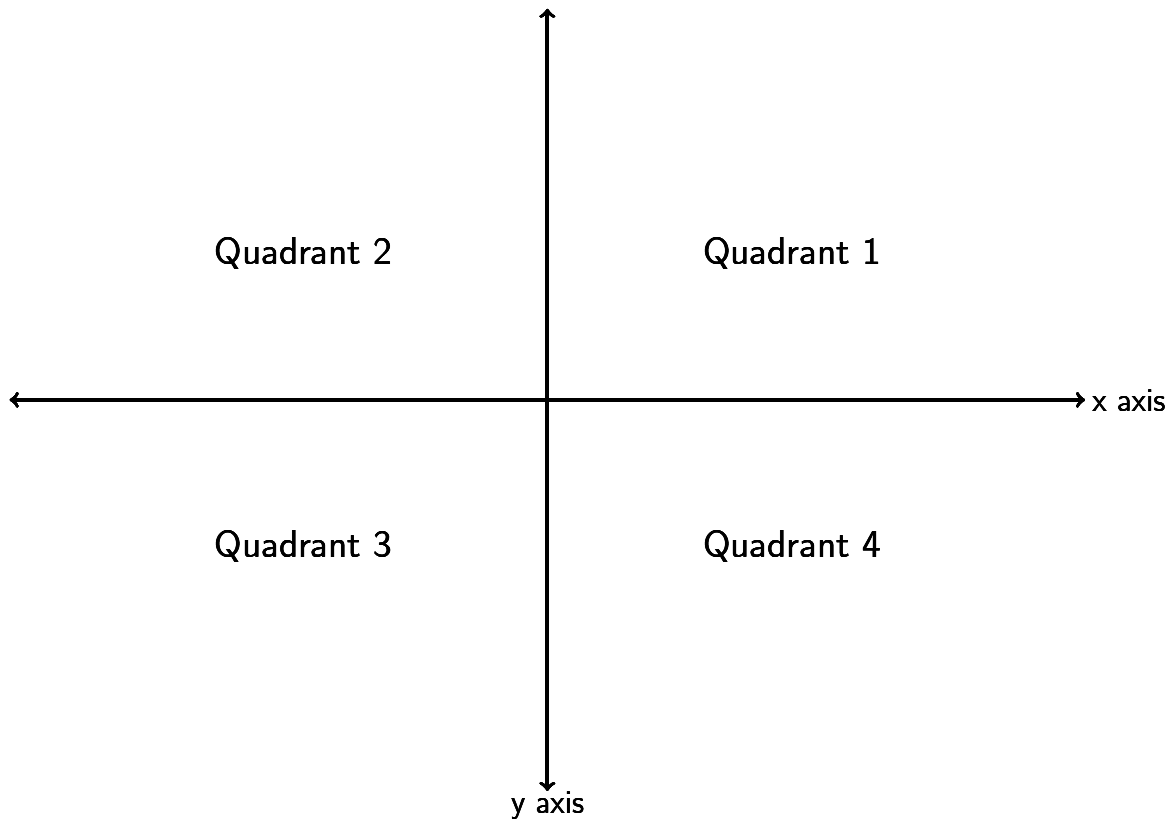
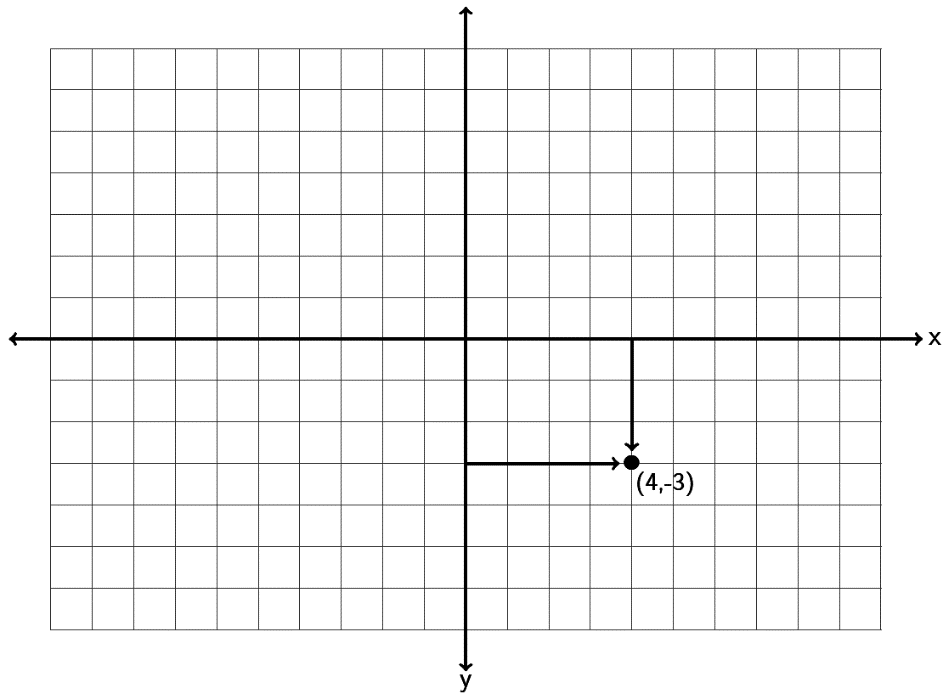
But how do we graph an ordered pair? Find the value on the x-axis and the y-axis and go where the two meet. If you notice it makes an imaginary rectangle. This is why we call this the Rectangular Coordinate System.
Look at the ordered pair (4, -3). Find 4 on the x-axis and -3 on the y-axis. Where the two meet is the ordered pair ( 4, -3 ). We often call ordered pairs “points” since we draw a dot to represent that ordered pair.
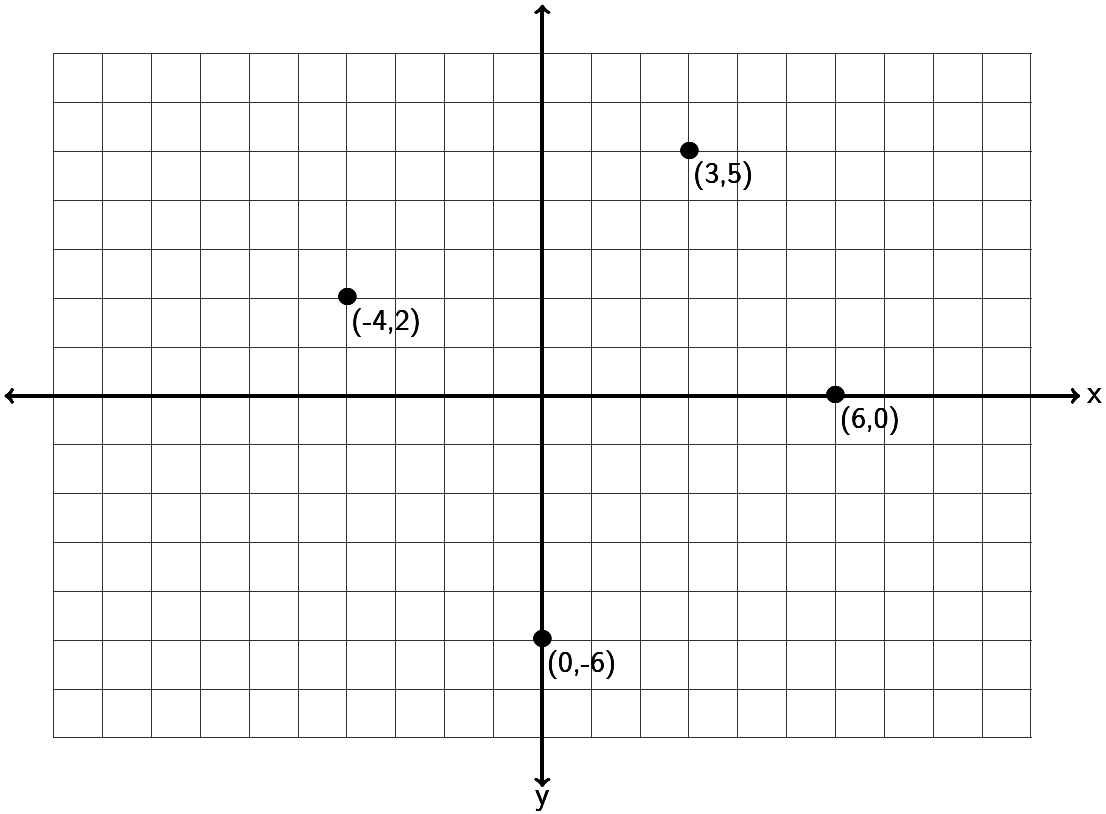
Now let’s plot some more ordered pairs and make a scatterplot. Let’s plot the points (-4, 2), (0, -5), (6, 0) and (3, 5). Notice that (-4,2) is in quadrant 2 and (3,5) is in quadrant 1. (0, -5) is a special point as it lies on the y-axis. It is therefore called a “y-intercept.” (6,0) lies on the x-axis so it is called an “x-intercept.” Points that lie on an axis are not in any particular quadrant. Notice that a y-intercept has an x-coordinate of zero, while an x-intercept has a y-coordinate of zero.
Do the following example with your instructor.
Plotting ordered pairs is vital to finding relationships between variables. Look at the profit data at the beginning of this section. If we plot all of those points we have the following scatterplot.
Scatterplot
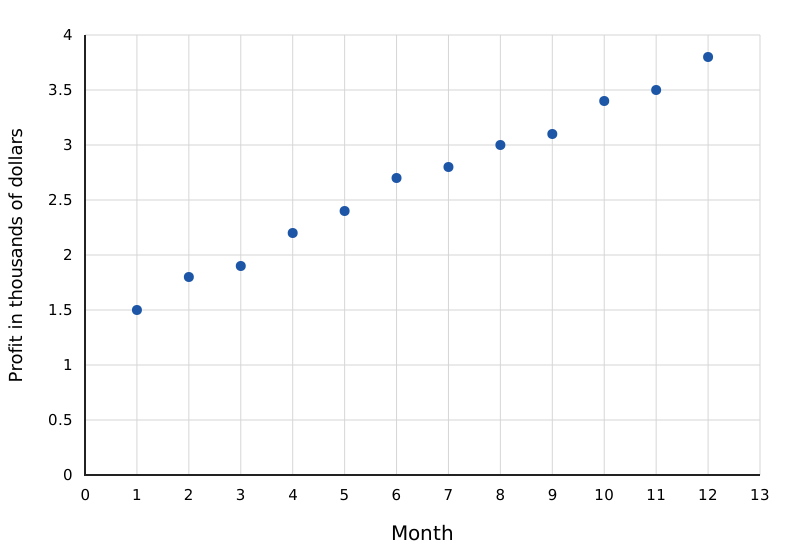
Since all the x and y coordinates are positive in the profit data, the points are all in the first quadrant. The scatterplot is just showing the first quadrant. In scatterplots we look for general trends. For example in this scatterplot, the points look pretty close to a line which suggests a linear trend. It seems as time increases, the profits for the cupcake shop are also increasing.
Practice Problems Section 7A
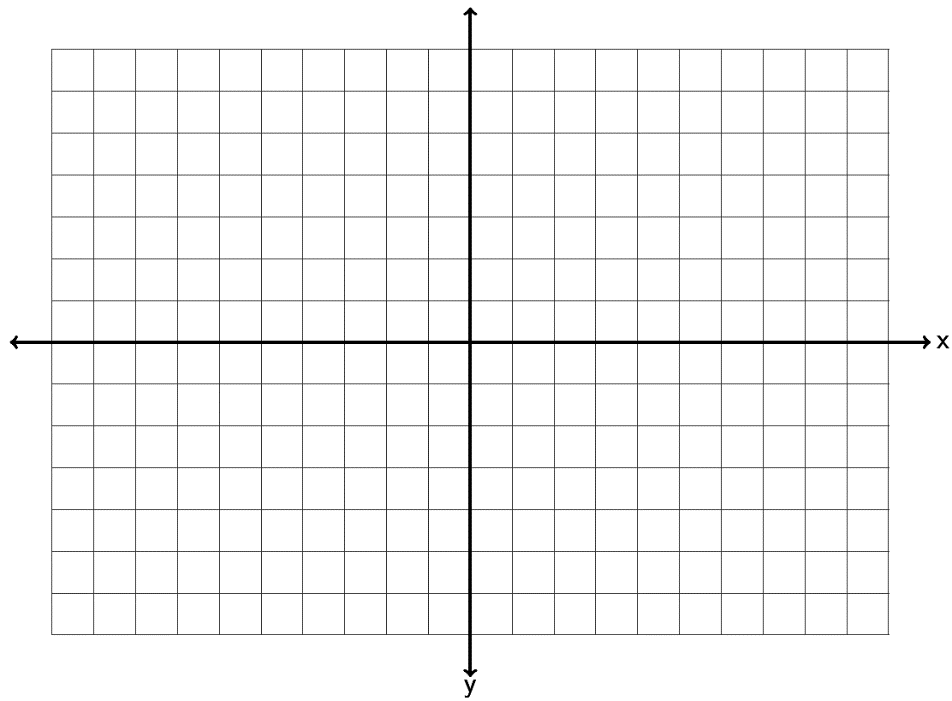
Graph the ordered pairs (2, -6), (-3,0), (-1, 4), (0, 4), (-1, -3) on the graph provided. Which point is an x-intercept? Which point is a y-intercept? For the other three points, give the quadrant they lie in.
Check answer
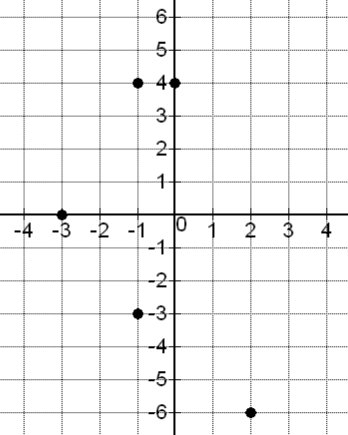
x-intercept: (-3, 0)
y-intercept: (0, 4)
(2, -6): Quadrant 4
(-1, 4): Quadrant 2
(-1, -3) Quadrant 3
Graph the ordered pairs (4, 2), (0,-1), (-6, -2), (3, 0), (-1, -6) on the graph provided. Which point is an x-intercept? Which point is a y-intercept? For the other three points, give the quadrant they lie in.
Graph the ordered pairs (-3, 2), (-2,0), (-7, -4), (0, 0), (4, -1) on the graph provided. Which points are x-intercepts? Which points are y-intercepts? For the other three points, give the quadrant they lie in.
Check answer
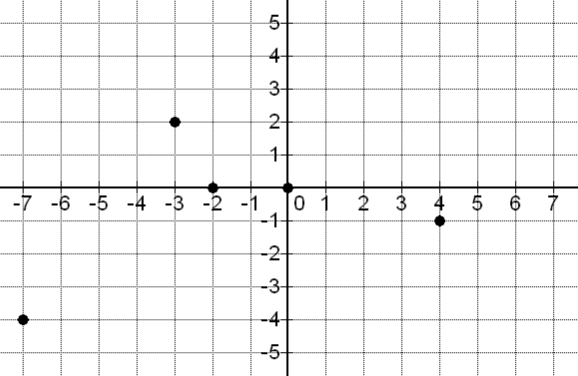
x-intercept: (-2, 0), (0, 0)
y-intercept: (0, 0)
(-3, 2): Quadrant 2
(-7, -4): Quadrant 3
(4, -1): Quadrant 4
Graph the ordered pairs (2.5, 3.5), (0,4.5), (-5.25, -3.3), (-5.5, 0), on the graph provided. Which point is an x-intercept? Which point is a y-intercept? For the other three points, give the quadrant they lie in.
Graph the ordered pairs (-3, -1), (-5,0), (4, -3), (0, 1), (-4, 6) on the graph provided. Which point is an x-intercept? Which point is a y-intercept? For any points not on the x-axis or y-axis, give the quadrant they lie in.
Check answer
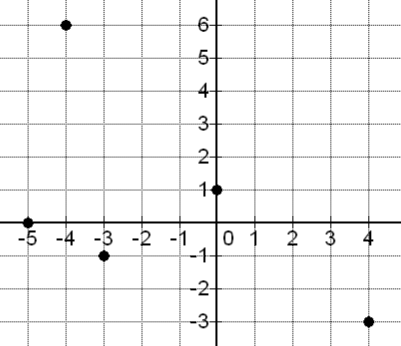
x-intercept: (-5, 0)
y-intercept: (0, 1)
(-3, -1): Quadrant 3
(4, -3): Quadrant 4
(-4, 6): Quadrant 2
Graph the ordered pairs (6, 1), (0,-5), (-2, -4), (4, 0), (-6, 5) on the graph provided. Which point is an x-intercept? Which point is a y-intercept? For any points not on the x-axis or y-axis, give the quadrant they lie in.
Graph the ordered pairs (-6, 2), (-3,0), (-4, -5), (0, 0), (5, -1) on the graph provided. Which points are x-intercepts? Which points are y-intercepts? For any points not on the x-axis or y-axis, give the quadrant they lie in.
Check answer
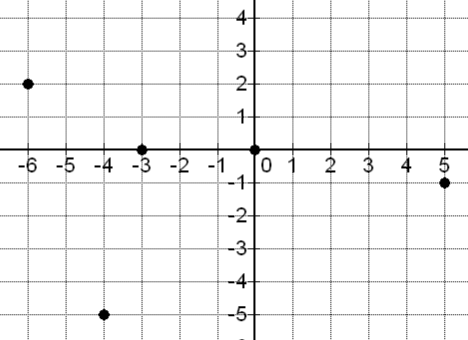
x-intercept: (-3, 0), (0, 0)
y-intercept: (0, 0)
(-6, 2): Quadrant 2
(-4, -5): Quadrant 3
(5, -1): Quadrant 4
Graph the ordered pairs (-1.25, 4.5), (0, -1.33), (5.5, -2.3), (3.5, 0), on the graph provided. Which point is an x-intercept? Which point is a y-intercept? For any points not on the x-axis or y-axis, give the quadrant they lie in.
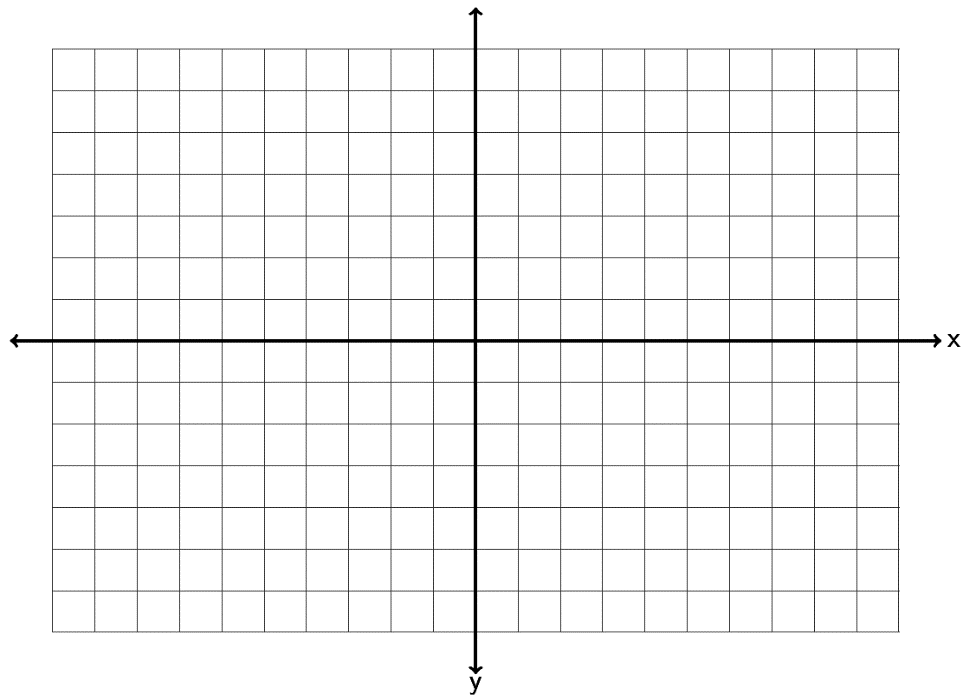
Graph the ordered pairs (6, -6), (-7,0), (-1, 7), (0, 6), (-5, -3) on the graph provided. Which point is an x-intercept? Which point is a y-intercept? For any points not on the x-axis or y-axis, give the quadrant they lie in.
Check answer
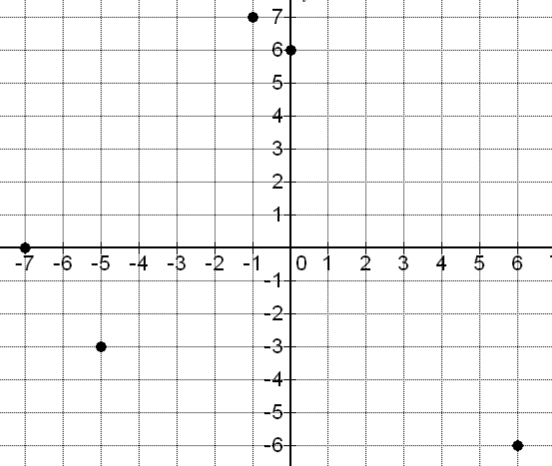
x-intercept: (-7, 0)
y-intercept: (0, 6)
(6, -6): Quadrant 4
(-1, 7): Quadrant 2
(-5, -3): Quadrant 3
Graph the ordered pairs (-3.5, 2.5), (0, -0.5), (-3.5, -6.5), (-6.5, 0), (-5.5, -1) on the graph provided. Which point is an x-intercept? Which point is a y-intercept? For any points not on the x-axis or y-axis, give the quadrant they lie in.
Graph the ordered pairs (-4, -1.25), (-2.5, 0), (-7.25, -4), (0, 0), (4.25, -3.25) on the graph provided. Which points are x-intercepts? Which points are y-intercepts? For any points not on the x-axis or y-axis, give the quadrant they lie in.
Check answer
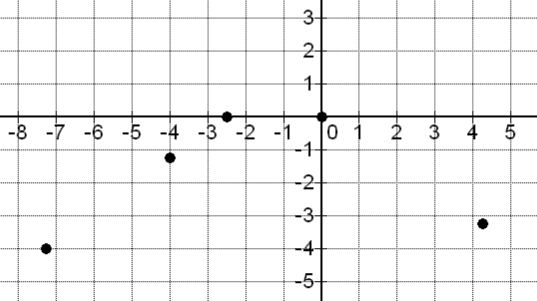
x-intercept: (-2.5, 0), (0, 0)
y-intercept: (0, 0)
(-4, -1.25): Quadrant 3
(-7.25,-4): Quadrant 3
(4.25, -3.25): Quadrant 4
Graph the ordered pairs (6.75, 3.25), ( 0, -4.75), (-4.25, -6.3), (-5.25, 0.75), on the graph provided. Which point is an x-intercept? Which point is a y-intercept? For any points not on the x-axis or y-axis, give the quadrant they lie in.
The following scatterplot looks at 13 breakfast cereals and the relationship between grams of sugar (x) and grams of fiber (y).
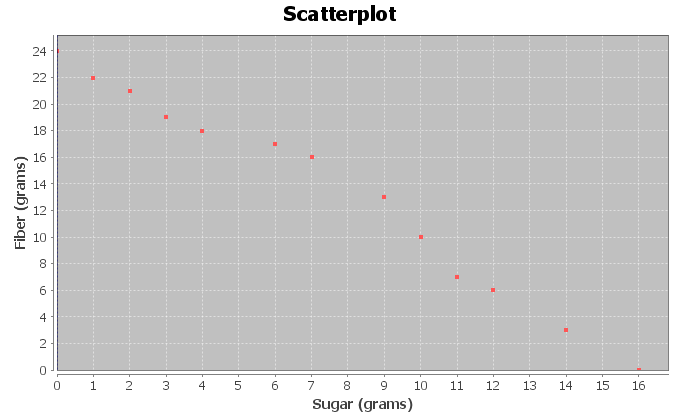
- For each ordered pair, give the x and y-coordinates. Which is the x-intercept? Which is the y-intercept?
- Do the points seem to be close to a line? If so does the line go up or down from left to right?
- Complete the following sentence: As the amount of sugar increases, the amount of fiber _________________.
- Complete the following sentence. As the amount of sugar decreases, the amount of fiber _________________.
Check answer
a) From the top-left,
(0, 24), (1, 22), (2, 21), (3, 19), (4, 18), (6, 17), (7, 16), (9, 13), (10, 10), (11, 7), (12, 6), (14, 3), (16,0)
The x-intercept is (16,0). The y-intercept is (0, 24).
b) Yes, the points seem to be close to a line that goes down from the left to right.
c) Decreases
d) Increases
The following scatterplot looks at 13 breakfast cereals and the relationship between carbohydrates (x) and total calories (y).
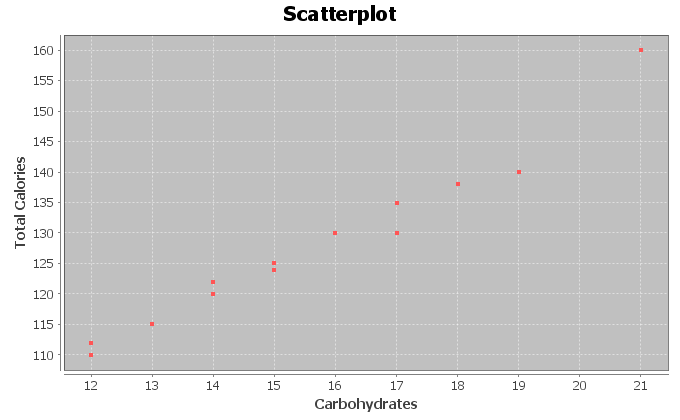
- For each ordered pair, give the x and y-coordinates. Which quadrant are all these points in?
- Do the points seem to be close to a line? If so does the line go up or down from left to right?
- Complete the following sentence: As the number of carbs increases, the total number of calories _________________.
- Complete the following sentence. As the number of carbs decreases, the total number of calories _________________.
Adapted from Preparing for Algebra and Statistics, Third Edition, by Matt Teachout. License: CC BY 4.0. Copyright and sources.