Login
📚 Prealgebra 2e
Chapters ▾
⇩ Download ▾

11.5 Understand Slope of a Line

As we’ve been graphing linear equations, we’ve seen that some lines slant up as they go from left to right and some lines slant down. Some lines are very steep and some lines are flatter. What determines whether a line slants up or down, and if its slant is steep or flat?

The steepness of the slant of a line is called the slope of the line. The concept of slope has many applications in the real world. The pitch of a roof and the grade of a highway or wheelchair ramp are just some examples in which you literally see slopes. And when you ride a bicycle, you feel the slope as you pump uphill or coast downhill.

Use Geoboards to Model Slope

In this section, we will explore the concepts of slope.

Using rubber bands on a geoboard gives a concrete way to model lines on a coordinate grid. By stretching a rubber band between two pegs on a geoboard, we can discover how to find the slope of a line.

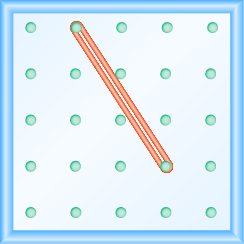
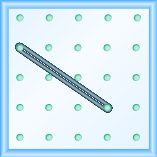
We’ll start by stretching a rubber band between two pegs to make a line as shown in Figure 11.21.
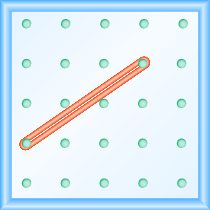
The figure shows a grid of evenly spaced dots. There are 5 rows and 5 columns. There is a rubber band style loop connecting the point in column 1 row 4 and the point in column 4 row 2.
Figure 11.21

Does it look like a line?

Now we stretch one part of the rubber band straight up from the left peg and around a third peg to make the sides of a right triangle as shown in Figure 11.22. We carefully make a 90° angle around the third peg, so that one side is vertical and the other is horizontal.
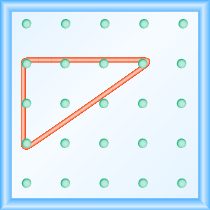
The figure shows a grid of evenly spaced dots. There are 5 rows and 5 columns. There is a rubber band style triangle connecting three of the three points at column 1 row 2, column 1 row 4,and column 4 row 2.
Figure 11.22

To find the slope of the line, we measure the distance along the vertical and horizontal legs of the triangle. The vertical distance is called the rise and the horizontal distance is called the run, as shown in Figure 11.23.
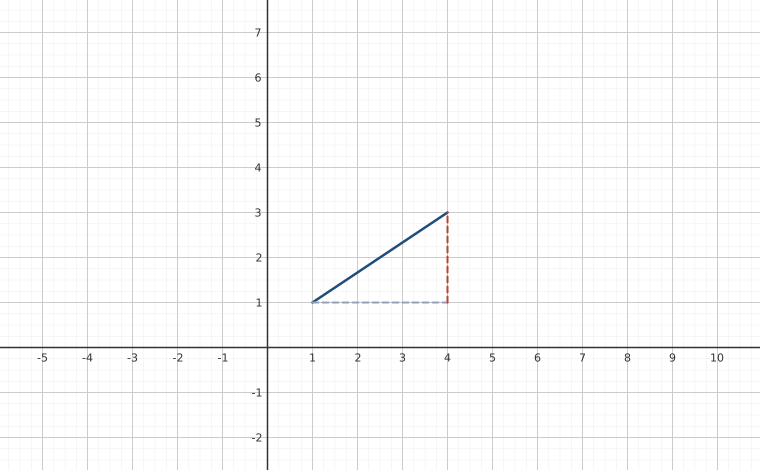
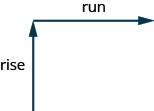
This figure shows two arrows. The first arrow is vertical and is labeled “rise”. The second arrow begins at the end of the first arrow extending to the right and is labeled “run”.
Figure 11.23

To help remember the terms, it may help to think of the images shown in Figure 11.24.
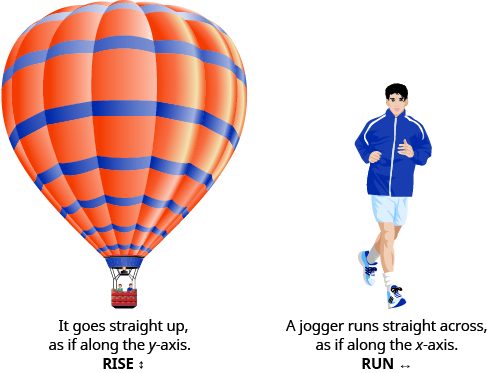
The figure shows an image of a hot air balloon signifying rise as the balloon rises straight up, similar to a y-axis. The second image is of a person jogging, signifying run as the person runs as if they are on an x-axis
Figure 11.24

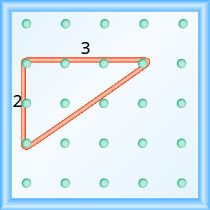
On our geoboard, the rise is 2 units because the rubber band goes up 2 spaces on the vertical leg. See Figure 11.25.

What is the run? Be sure to count the spaces between the pegs rather than the pegs themselves! The rubber band goes across 3 spaces on the horizontal leg, so the run is 3 units.

The figure shows a grid of evenly spaced dots. There are 5 rows and 5 columns. There is a rubber band style triangle connecting three of the three points at column 1 row 2, column 1 row 4, and column 4 row 2. The triangle has a rise of 2 units and a run of 3 units.
Figure 11.25

The slope of a line is the ratio of the rise to the run. So the slope of our line is 23. In mathematics, the slope is always represented by the letter m.

What is the slope of the line on the geoboard in Figure 11.25?
m=riserun

m=23

The line has slope23.

When we work with geoboards, it is a good idea to get in the habit of starting at a peg on the left and connecting to a peg to the right. Then we stretch the rubber band to form a right triangle.
If we start by going up the rise is positive, and if we stretch it down the rise is negative. We will count the run from left to right, just like you read this paragraph, so the run will be positive.

Since the slope formula has rise over run, it may be easier to always count out the rise first and then the run.
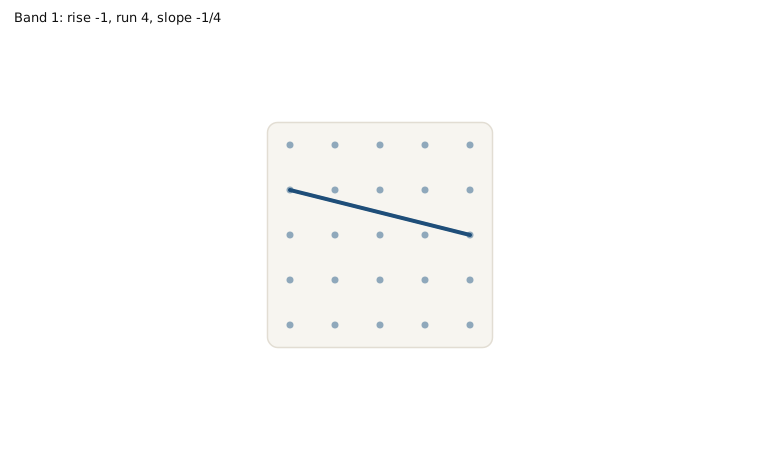
Notice that in the first example, the slope is positive and in the second example the slope is negative. Do you notice any difference in the two lines shown in Figure 11.26.
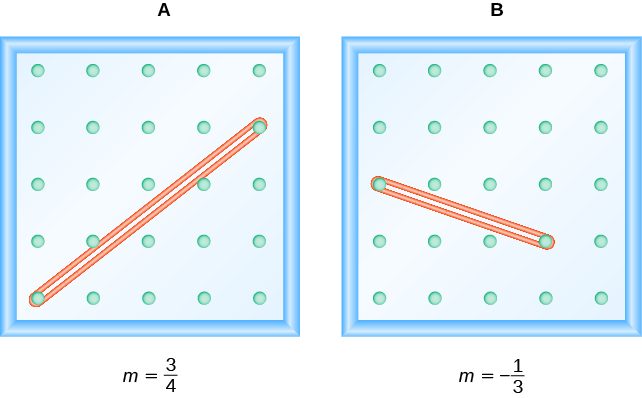
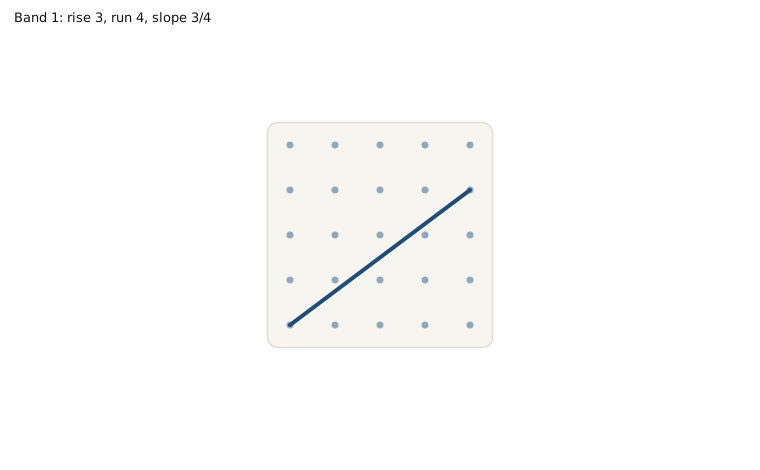
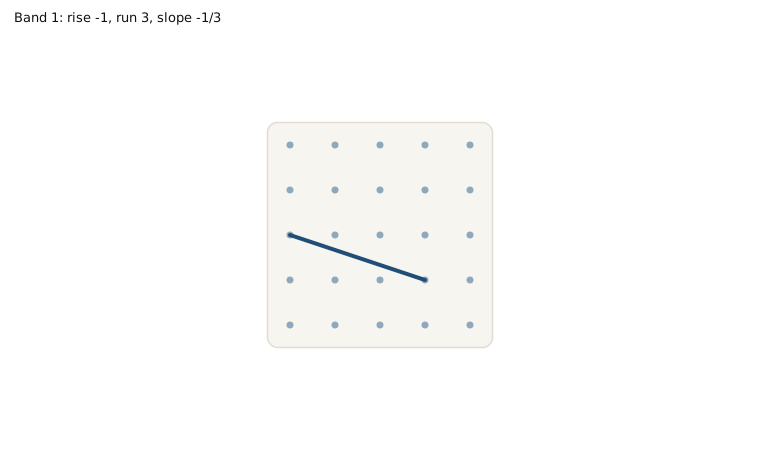
The figure shows two grids of evenly spaced dots. There are 5 rows and 5 columns in each. In the left grid A, a rubberband loops to connect the point in column 1, row 1 and the point in column 5, row 4. In the right grid B, a rubber band loops to connect the point in column 1, row 4 and the point in column 4, row 2.
Figure 11.26

As you read from left to right, the line in Figure A, is going up; it has positive slope. The line Figure B is going down; it has negative slope.
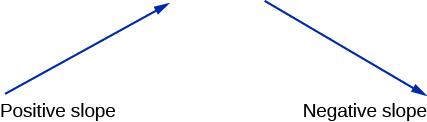
This image shows two arrows: the left arrow is labeled positive slope and points upward towards the right. The right arrow is labeled negative slope and points downward towards the right.
Figure 11.27

Find the Slope of a Line from its Graph

Now we’ll look at some graphs on a coordinate grid to find their slopes. The method will be very similar to what we just modeled on our geoboards.

To find the slope, we must count out the rise and the run. But where do we start?

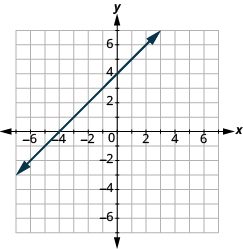
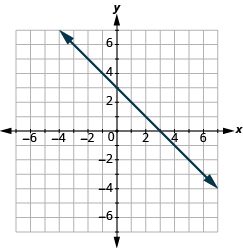
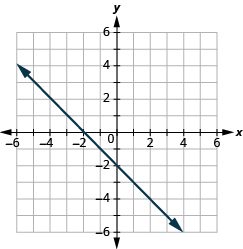
We locate any two points on the line. We try to choose points with coordinates that are integers to make our calculations easier. We then start with the point on the left and sketch a right triangle, so we can count the rise and run.

The lines in the previous examples had y-intercepts with integer values, so it was convenient to use the y-intercept as one of the points we used to find the slope. In the next example, the y-intercept is a fraction. The calculations are easier if we use two points with integer coordinates.

Find the Slope of Horizontal and Vertical Lines

Do you remember what was special about horizontal and vertical lines? Their equations had just one variable.

  • horizontal line y=b; all the y-coordinates are the same.
  • vertical line x=a; all the x-coordinates are the same.

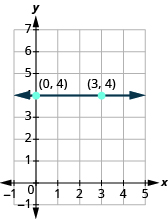
So how do we find the slope of the horizontal line y=4? One approach would be to graph the horizontal line, find two points on it, and count the rise and the run. Let’s see what happens in Figure 11.28. We’ll use the two points (0,4) and (3,4) to count the rise and run.

The graph shows the x y-coordinate plane. The x-axis runs from -1 to 5. The y-axis runs from -1 to 7. A horizontal line passes through the labeled points “ordered pair 0, 4” and “ordered pair 3, 4”.
Figure 11.28
What is the rise?The rise is 0.
What is the run?The run is 3.
What is the slope?m=riserun
m=03
m=0

The slope of the horizontal line y=4 is 0.

All horizontal lines have slope 0. When the y-coordinates are the same, the rise is 0.

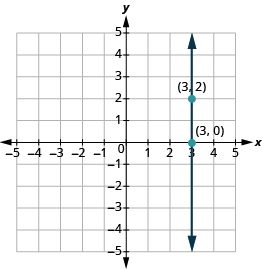
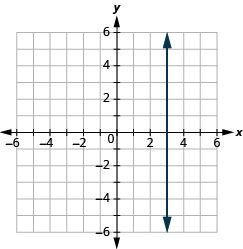
Now we’ll consider a vertical line, such as the line x=3, shown in Figure 11.29. We’ll use the two points (3,0) and (3,2) to count the rise and run.

The graph shows the x y-coordinate plane. Both axes run from -5 to 5. A vertical line passes through the labeled points “ordered pair 3, 2” and “ordered pair 3, 0”.
Figure 11.29
What is the rise?The rise is 2.
What is the run?The run is 0.
What is the slope?m=riserun
m=20

But we can’t divide by 0. Division by 0 is undefined. So we say that the slope of the vertical line x=3 is undefined. The slope of all vertical lines is undefined, because the run is 0.

Use the Slope Formula to find the Slope of a Line between Two Points

Sometimes we need to find the slope of a line between two points and we might not have a graph to count out the rise and the run. We could plot the points on grid paper, then count out the rise and the run, but there is a way to find the slope without graphing.

Before we get to it, we need to introduce some new algebraic notation. We have seen that an ordered pair (x,y) gives the coordinates of a point. But when we work with slopes, we use two points. How can the same symbol (x,y) be used to represent two different points?

Mathematicians use subscripts to distinguish between the points. A subscript is a small number written to the right of, and a little lower than, a variable.

  • (x1,y1)readxsub1,ysub1
  • (x2,y2)readxsub2,ysub2

We will use (x1,y1) to identify the first point and (x2,y2) to identify the second point. If we had more than two points, we could use (x3,y3),(x4,y4), and so on.

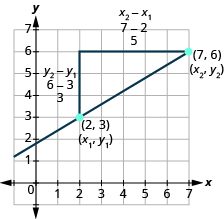
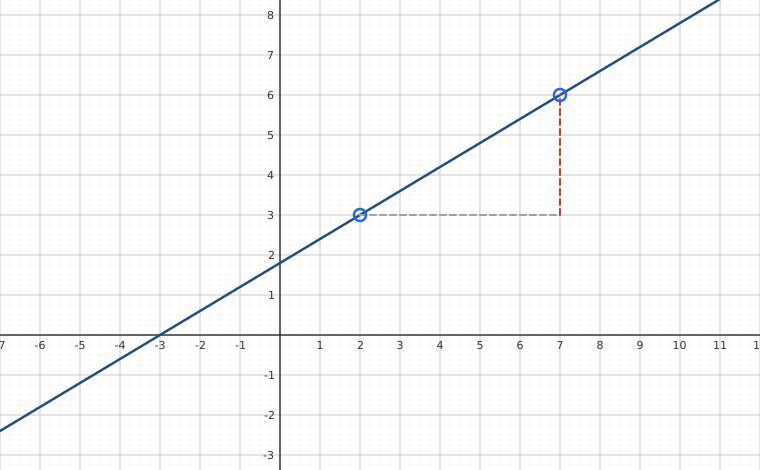
To see how the rise and run relate to the coordinates of the two points, let’s take another look at the slope of the line between the points (2,3) and (7,6) in Figure 11.30.

The graph shows the x y-coordinate plane. The x-axis runs from 0 to 7. The y-axis runs from 0 to 7. A line runs through the labeled points 2, 3 and 7, 6. A line segment runs from the point 2, 3 to the unlabeled point 2, 6. It is labeled y sub 2 minus y sub 1, 6 minus 3, 3. A line segment runs from the point 7, 6 to the unlabeled point 2, 6.  It os labeled x sub 2 minus x sub 1, 7 minus 2, 5.
Figure 11.30

Since we have two points, we will use subscript notation.

(2,3)x1,y1(7,6)x2,y2

On the graph, we counted the rise of 3. The rise can also be found by subtracting the y-coordinates of the points.

y2y1633

We counted a run of 5. The run can also be found by subtracting the x-coordinates.

x2x1725

We knowm=riserun
Som=35
We rewrite the rise and run by putting in the coordinates.m=6372
But 6 is the y-coordinate of the second point, y2
and 3 is the y-coordinate of the first point y1.
So we can rewrite the rise using subscript notation.
m=y2y172
Also 7 is the x-coordinate of the second point, x2
and 2 is the x-coordinate of the first point x2.
So we rewrite the run using subscript notation.
m=y2y1x2x1

We’ve shown that m=y2y1x2x1 is really another version of m=riserun. We can use this formula to find the slope of a line when we have two points on the line.
Say the formula to yourself to help you remember it:

Slope isyof the second point minusyof the first point

over

xof the second point minusxof the first point.

How do we know which point to call #1 and which to call #2? Let’s find the slope again, this time switching the names of the points to see what happens. Since we will now be counting the run from right to left, it will be negative.

We’ll call (4,5) point #1 and (1,2) point #2.(4,5)x1,y1and(1,2)x2,y2
Use the slope formula.m=y2y1x2x1
Substitute the values in the slope formula:
y of the second point minus y of the first pointm=25x2x1
x of the second point minus x of the first pointm=2514
Simplify the numerator and the denominator.m=−3−3
m=1

The slope is the same no matter which order we use the points.

Graph a Line Given a Point and the Slope

In this chapter, we graphed lines by plotting points, by using intercepts, and by recognizing horizontal and vertical lines.

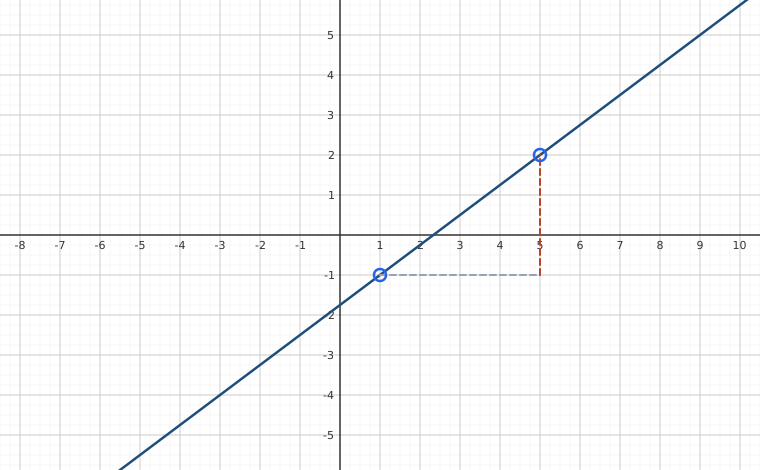
Another method we can use to graph lines is the point-slope method. Sometimes, we will be given one point and the slope of the line, instead of its equation. When this happens, we use the definition of slope to draw the graph of the line.
Solve Slope Applications

At the beginning of this section, we said there are many applications of slope in the real world. Let’s look at a few now.

Have you ever thought about the sewage pipes going from your house to the street? Their slope is an important factor in how they take waste away from your house.

Key Concepts

  • Find the slope from a graph
    1. Locate two points on the line whose coordinates are integers.
    2. Starting with the point on the left, sketch a right triangle, with the hypotenuse going from the first point to the second point.
    3. Count the rise and the run on the legs of the triangle.
    4. Take the ratio of rise to run to find the slope, m=riserun
  • Slope of a Horizontal Line
    • The slope of a horizontal line, y=b, is 0.
  • Slope of a Vertical Line
    • The slope of a vertical line, x=a, is undefined.
  • Slope Formula
    • The slope of the line between two points (x1,y1) and (x2,y2) is m=y2y1x2x1
  • Graph a line given a point and a slope.
    1. Plot the given point.
    2. Use the slope formula to identify the rise and the run.
    3. Starting at the given point, count out the rise and run to mark the second point.
    4. Connect the points with a line.

Section Exercises

Practice Makes Perfect

Use Geoboards to Model Slope

In the following exercises, find the slope modeled on each geoboard.

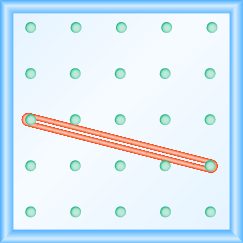
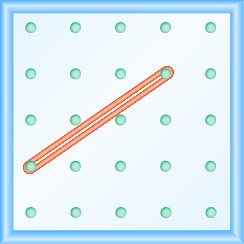
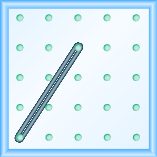
The figure shows a grid of evenly spaced dots. There are 5 rows and 5 columns. There is a rubber band style loop connecting the point in column 1 row 3 and the point in column 5 row 2.

14

The figure shows a grid of evenly spaced dots. There are 5 rows and 5 columns. There is a rubber band style loop connecting the point in column 2 row 4 and the point in column 5 row 2.
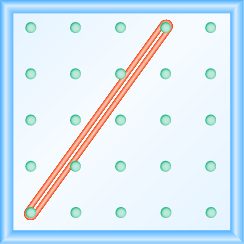
The figure shows a grid of evenly spaced dots. There are 5 rows and 5 columns. There is a rubber band style loop connecting the point in column 2 row 1 and the point in column 4 row 4.

32

The figure shows a grid of evenly spaced dots. There are 5 rows and 5 columns. There is a rubber band style loop connecting the point in column 2 row 1 and the point in column 4 row 4.

In the following exercises, model each slope. Draw a picture to show your results.

23

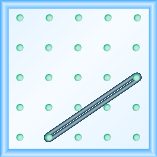
The figure shows a grid of evenly spaced dots. There are 5 rows and 5 columns. There is a rubber band style loop connecting the point in column 2 row 5 and the point in column 5 row 3.

34

14

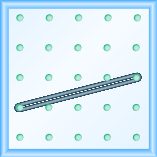
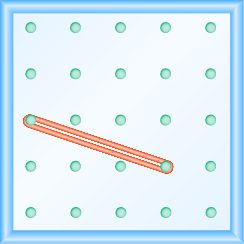
The figure shows a grid of evenly spaced dots. There are 5 rows and 5 columns. There is a rubber band style loop connecting the point in column 1 row 4 and the point in column 5 row 3.

43

12

The figure shows a grid of evenly spaced dots. There are 5 rows and 5 columns. There is a rubber band style loop connecting the point in column 1 row 4 and the point in column 3 row 5.

34

23

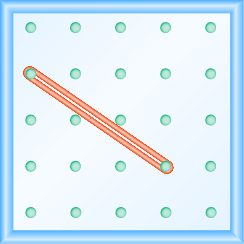
The figure shows a grid of evenly spaced dots. There are 5 rows and 5 columns. There is a rubber band style loop connecting the point in column 1 row 2 and the point in column 4 row 4.

32

Find the Slope of a Line from its Graph

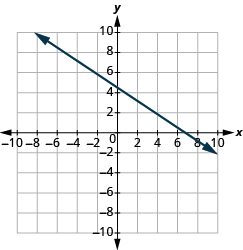
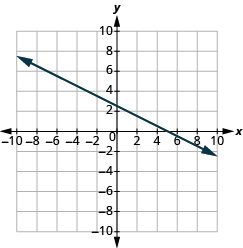
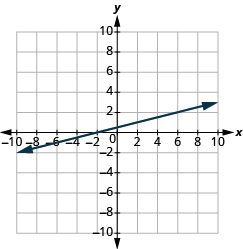
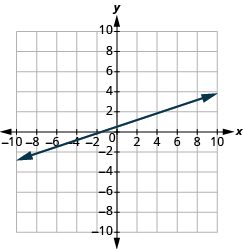
In the following exercises, find the slope of each line shown.

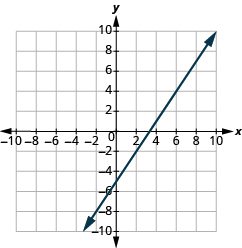
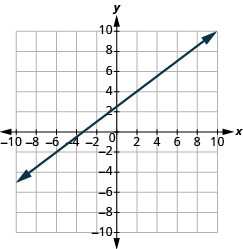
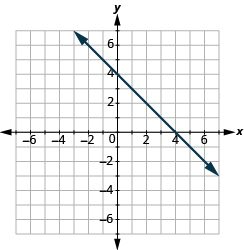
The graph shows the x y-coordinate plane. The x-axis runs from -10 to 10. The y-axis runs from -10 to 10. A line passes through the points “ordered pair 0, -4” and “ordered pair 10, 0”.

25

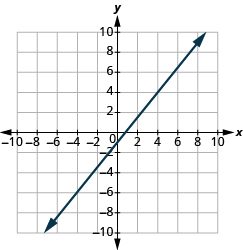
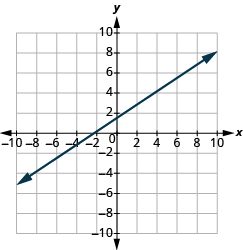
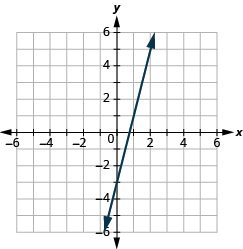
The graph shows the x y-coordinate plane. The x-axis runs from -10 to 10. The y-axis runs from -10 to 10. A line passes through the points “ordered pair 0, -5” and “ordered pair 3, 0”.
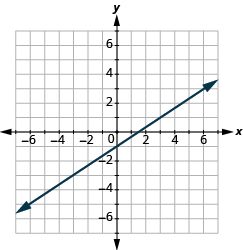
The graph shows the x y-coordinate plane. The x-axis runs from -12 to 12. The y-axis runs from -12 to 12. A line passes through the points “ordered pair 0, -1” and “ordered pair 1, 0”.

54

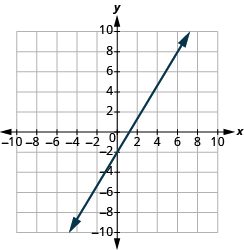
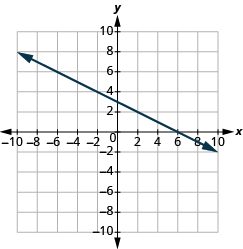
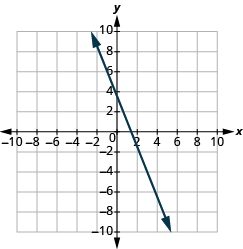
The graph shows the x y-coordinate plane. The x-axis runs from -10 to 10. The y-axis runs from -10 to 10. A line passes through the points “ordered pair 0, 3” and “ordered pair 6, 0”.
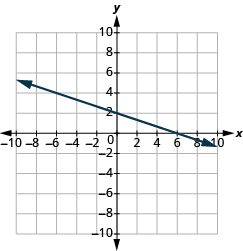
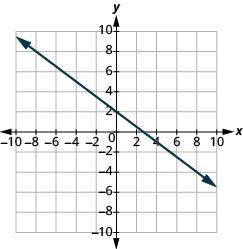
The graph shows the x y-coordinate plane. The x-axis runs from -10 to 10. The y-axis runs from -10 to 10. A line passes through the points “ordered pair 0, 2” and “ordered pair 6, 0”.

13

The graph shows the x y-coordinate plane. The x-axis runs from -10 to 10. The y-axis runs from -10 to 10. A line passes through the points “ordered pair 0, 2” and “ordered pair 6, 0”.
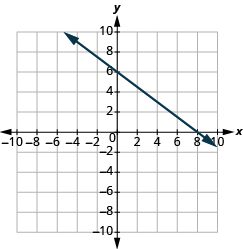
The graph shows the x y-coordinate plane. The x-axis runs from -10 to 10. The y-axis runs from -10 to 10. A line passes through the points “ordered pair 0, 6” and “ordered pair 8, 0”.

34

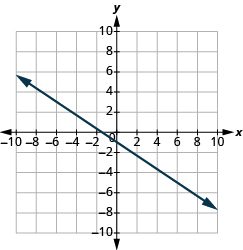
The graph shows the x y-coordinate plane. The x-axis runs from -10 to 10. The y-axis runs from -10 to 10. A line passes through the points “ordered pair -1,  0” and “ordered pair 0, -1”.
The graph shows the x y-coordinate plane. The x-axis runs from -10 to 10. The y-axis runs from -10 to 10. A line passes through the points “ordered pair -4,  0” and “ordered pair -4, 6”.

34

The graph shows the x y-coordinate plane. The x-axis runs from -10 to 10. The y-axis runs from -10 to 10. A line passes through the points “ordered pair -2,  0” and “ordered pair 4, 4”.
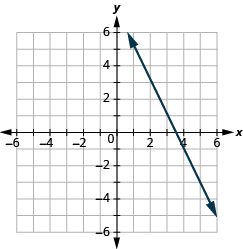
The graph shows the x y-coordinate plane. The x-axis runs from -10 to 10. A line passes through the points “ordered pair 0, 4” and “ordered pair 4, -6”.

52

The graph shows the x y-coordinate plane. The x-axis runs from -10 to 10. A line passes through the points “ordered pair -8, 8” and “ordered pair 8, -4”.
The graph shows the x y-coordinate plane. The x-axis runs from -10 to 10. A line passes through the points “ordered pair 1,  4” and “ordered pair 7, 0”.

23

The graph shows the x y-coordinate plane. The x-axis runs from -10 to 10. A line passes through the points “ordered pair 0,  3” and “ordered pair 7, 0”.
The graph shows the x y-coordinate plane. The x-axis runs from -10 to 10. A line passes through the points “ordered pair 2, 0” and “ordered pair 10, 4”.

14

The graph shows the x y-coordinate plane. The x-axis runs from -10 to 10. A line passes through the points “ordered pair 6,  2” and “ordered pair 0, -3”.

Find the Slope of Horizontal and Vertical Lines

In the following exercises, find the slope of each line.

y=3

0

y=1

x=4

undefined

x=2

y=−2

0

y=−3

x=−5

undefined

x=−4

Use the Slope Formula to find the Slope of a Line between Two Points

In the following exercises, use the slope formula to find the slope of the line between each pair of points.

(1,4),(3,9)

52

(2,3),(5,7)

(0,3),(4,6)

34

(0,1),(5,4)

(2,5),(4,0)

52

(3,6),(8,0)

(−3,3),(2,−5)

85

(−2,4),(3,−1)

(−1,−2),(2,5)

73

(−2,−1),(6,5)

(4,−5),(1,−2)

−1

(3,−6),(2,−2)

Graph a Line Given a Point and the Slope

In the following exercises, graph the line given a point and the slope.

(1,−2);m=34

The graph shows the x y-coordinate plane. The x-axis runs from -12 to 12. The y-axis runs from 12 to -12. A line passes through the points “ordered pair 5,  1” and “ordered pair 1, -2”

(1,−1);m=12

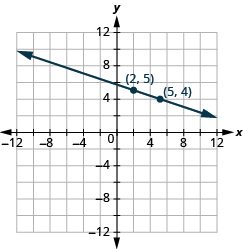
(2,5);m=13

The graph shows the x y-coordinate plane. The x-axis runs from -12 to 12. The y-axis runs from 12 to -12. A line passes through the points “ordered pair 2, 5” and “ordered pair 5, 4”.

(1,4);m=12

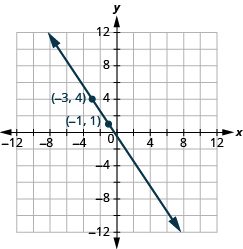
(−3,4);m=32

The graph shows the x y-coordinate plane. The x-axis runs from -12 to 12. The y-axis runs from 12 to -12. A line passes through the points “ordered pair -3, 4” and “ordered pair -1, 1”.

(−2,5);m=54

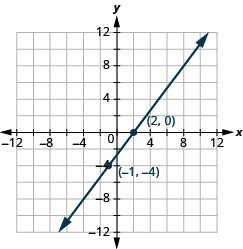
(−1,−4);m=43

The graph shows the x y-coordinate plane. The x-axis runs from -12 to 12. The y-axis runs from 12 to -12. A line passes through the points “ordered pair 2,0” and “ordered pair -1, -4”.

(−3,−5);m=32

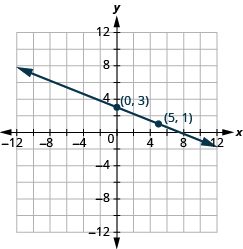
(0,3);m=25

The graph shows the x y-coordinate plane. The x-axis runs from -12 to 12. The y-axis runs from 12 to -12. A line passes through the points “ordered pair 0, 3” and “ordered pair 5, 1”.

(0,5);m=43

(−2,0);m=34

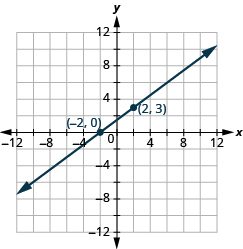
The graph shows the x y-coordinate plane. The x-axis runs from -12 to 12. The y-axis runs from 12 to -12. A line passes through the points “ordered pair -2,0” and “ordered pair 2, 3”.

(−1,0);m=15

(−3,3);m=2

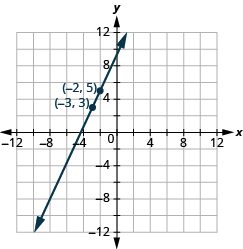
The graph shows the x y-coordinate plane. The x-axis runs from -12 to 12. The y-axis runs from 12 to -12. A line passes through the points “ordered pair -3, 3” and “ordered pair -2, 5”.

(−4,2);m=4

(1,5);m=−3

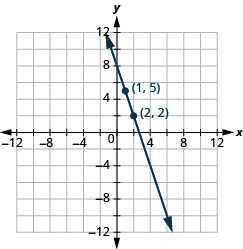
The graph shows the x y-coordinate plane. The x-axis runs from -12 to 12. The y-axis runs from 12 to -12. A line passes through the points “ordered pair 1, 5” and “ordered pair 2, 2”.

(2,3);m=−1

Solve Slope Applications

In the following exercises, solve these slope applications.

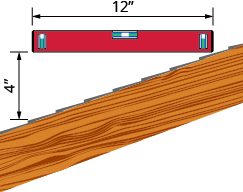
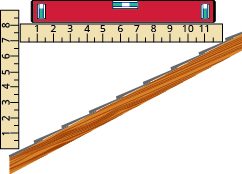
Slope of a roof A fairly easy way to determine the slope is to take a 12-inch level and set it on one end on the roof surface. Then take a tape measure or ruler, and measure from the other end of the level down to the roof surface. You can use these measurements to calculate the slope of the roof. What is the slope of the roof in this picture?

The figure shows a wood board at a diagonal representing a side-view slice of a pitched roof. A vertical line segment with arrows on both ends measures the vertical change in height of the roof and is labeled “4 inches”. A level tool is in a horizontal position above the board and above it is a line segment with arrows on both ends labeled “12 inches”.

13

What is the slope of the roof shown?

The figure shows a  diagonal side-view slice of a pitched roof. A ruler in vertical position is at the bottom of the roof segment and shows unit labels 1 through 8 and extends one further unit. A second ruler starts at the “7” label of the vertical ruler and extends horizontally until it hits the rising roof. The horizontal ruler has unit labels 1 through 11 and extends one further unit.

Road grade A local road has a grade of 6%. The grade of a road is its slope expressed as a percent.

  1. ⓐ Find the slope of the road as a fraction and then simplify the fraction.
  2. ⓑ What rise and run would reflect this slope or grade?

350rise=3;run=50

Highway grade A local road rises 2 feet for every 50 feet of highway.

  1. ⓐ What is the slope of the highway?
  2. ⓑ The grade of a highway is its slope expressed as a percent. What is the grade of this highway?

Everyday Math

Wheelchair ramp The rules for wheelchair ramps require a maximum 1 inch rise for a 12 inch run.

  1. ⓐ What run must the ramp have to accommodate a 24-inch rise to the door?
  2. ⓑ Draw a model of this ramp.
  1. ⓐ 288 inches (24 feet)
  2. ⓑ Models will vary.

Wheelchair ramp A 1-inch rise for a 16-inch run makes it easier for the wheelchair rider to ascend the ramp.

  1. ⓐ What run must the ramp have to easily accommodate a 24-inch rise to the door?
  2. ⓑ Draw a model of this ramp.

Writing Exercises

What does the sign of the slope tell you about a line?

Answers will vary.

How does the graph of a line with slope m=12 differ from the graph of a line with slope m=2?

Why is the slope of a vertical line undefined?

Answers will vary.

Explain how you can graph a line given a point and its slope.

Self Check

ⓐ After completing the exercises, use this checklist to evaluate your mastery of the objectives of this section.

A self-assessment checklist for students to rate their understanding and confidence in various skills related to finding, graphing, and applying slope, with options: Confidently, With some help, or No-I don't get it!
Figure 11.31

ⓑ On a scale of 1–10, how would you rate your mastery of this section in light of your responses on the checklist? How can you improve this?

Chapter Review Exercises

Use the Rectangular Coordinate System

Plot Points in a Rectangular Coordinate System

In the following exercises, plot each point in a rectangular coordinate system.

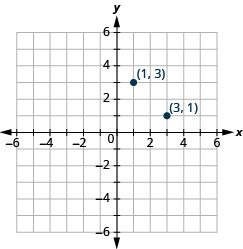
(1,3),(3,1)

The graph shows the x y-coordinate plane. The x-axis runs from -6 to 6. The y-axis runs from 6 to -6. The points “ordered pair 1,3” and “ordered pair 3,1” are plotted.

(2,5),(5,2)

In the following exercises, plot each point in a rectangular coordinate system and identify the quadrant in which the point is located.

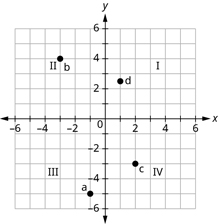
  1. (−1,−5)
  2. (−3,4)
  3. (2,−3)
  4. (1,52)
  1. ⓐ III
  2. ⓑ II
  3. ⓒ IV
  4. ⓐ I

A Cartesian coordinate plane, also known as an xy-grid, displays four quadrants (I, II, III, IV) and four distinct points labeled a, b, c, and d, plotted within these quadrants.

  1. (3,−2)
  2. (−4,−1)
  3. (−5,4)
  4. (2,103)

Identify Points on a Graph

In the following exercises, name the ordered pair of each point shown in the rectangular coordinate system.

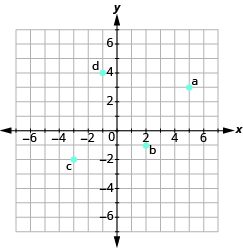
The graph shows the x y-coordinate plane. The axes run from -7 to 7. “a” is plotted at 5, 3, “b” at 2, -1, “c” at -3,-2, and “d” at -1,4.
  1. ⓐ (5,3)
  2. ⓑ (2,−1)
  3. ⓒ (−3,−2)
  4. ⓓ (−1,4)
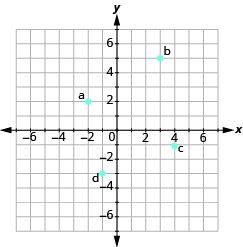
The graph shows the x y-coordinate plane. The axes run from -7 to 7. “a” is plotted at -2, 2, “b” at 3, 5, “c” at 4,-1, and “d” at -1,3.
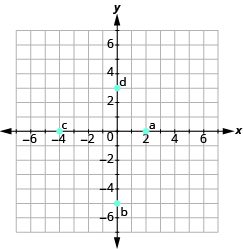
The graph shows the x y-coordinate plane. The axes run from -7 to 7. “a” is plotted at 2, 0, “b” at 0, -5, “c” at -4,0, and “d” at 0,3.
  1. ⓐ (2,0)
  2. ⓑ (0,−5)
  3. ⓒ (−4,0)
  4. ⓓ (0,3)
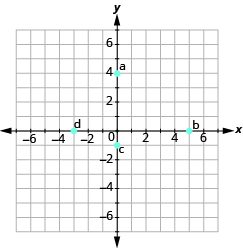
The graph shows the x y-coordinate plane. The axes run from -7 to 7. “a” is plotted at 0, 4, “b” at 5, 0, “c” at 0,-1, and “d” at -3,0.

Verify Solutions to an Equation in Two Variables

In the following exercises, find the ordered pairs that are solutions to the given equation.

5x+y=10

  1. (5,1)
  2. (2,0)
  3. (4,−10)

ⓑ (2, 0),ⓒ (4, –10)

y=6x2

  1. (1,4)
  2. (13,0)
  3. (6,−2)

Complete a Table of Solutions to a Linear Equation in Two Variables

In the following exercises, complete the table to find solutions to each linear equation.

y=4x1

xy(x,y)
0
1
−2
xy(x,y)
0−1(0,−1)
13(1,3)
−2−9(−2,−9)

y=12x+3

xy(x,y)
0
1
−2

x+2y=5

xy(x,y)
0
1
−1
xy(x,y)
50(5,0)
12(1,2)
−13(−1,3)

3x2y=6

xy(x,y)
0
0
−2

Find Solutions to a Linear Equation in Two Variables

In the following exercises, find three solutions to each linear equation.

x+y=3

Answers will vary.

x+y=−4

y=3x+1

Answers will vary.

y=x1

Graphing Linear Equations

Recognize the Relation Between the Solutions of an Equation and its Graph

In each of the following exercises, an equation and its graph is shown. For each ordered pair, decide

  1. ⓐ if the ordered pair is a solution to the equation.
  2. ⓑ if the point is on the line.

y=x+4

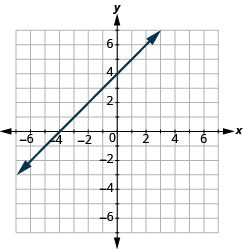
The graph shows the x y-coordinate plane. The axes run from -7 to 7. A line passes through the points “ordered pair 0,  4” and “ordered pair 4, 0”.

  1. (0,4)
  2. (−1,3)
  3. (2,2)
  4. (−2,6)
  1. ⓐ yes ⓑ yes
  2. ⓐ no ⓑ no
  3. ⓐ yes ⓑ yes
  4. ⓐ yes ⓑ yes

y=23x1

The graph shows the x y-coordinate plane. The axes run from -7 to 7. A line passes through the points “ordered pair 0,  -1” and “ordered pair 3, 1”.

  1. (0,−1)
  2. (3,1)
  3. (−3,−3)
  4. (6,4)

Graph a Linear Equation by Plotting Points

In the following exercises, graph by plotting points.

y=4x3

The graph shows the x y-coordinate plane. Each axis runs from -6 to 6. A line passes through the points “ordered pair 1,  1” and “ordered pair 0, -3”.

y=−3x

2x+y=7

The graph shows the x y-coordinate plane. Each axis runs from -6 to 6.  A line passes through the points “ordered pair 1,  5” and “ordered pair 0, 7”.

Graph Vertical and Horizontal lines

In the following exercises, graph the vertical or horizontal lines.

y=−2

x=3

The graph shows the x y-coordinate plane. Each axis runs from -6 to 6. A vertical line passes through the point “ordered pair 0, 3”.

Graphing with Intercepts

Identify the Intercepts on a Graph

In the following exercises, find the x and y-intercepts.

The graph shows the x y-coordinate plane. The axes run from -7 to 7. A line passes through the points “ordered pair 0,  4” and “ordered pair -4, 0”.
The graph shows the x y-coordinate plane. The x-axis runs from -1 to 6. The y-axis runs from -4 to 2. A line passes through the points “ordered pair 5,  1” and “ordered pair 0, -3”.

(0,3) (3,0)

Find the Intercepts from an Equation of a Line

In the following exercises, find the intercepts.

x+y=5

xy=−1

(−1,0) (0,1)

y=34x12

y=3x

(0,0)

Graph a Line Using the Intercepts

In the following exercises, graph using the intercepts.

x+3y=3

x+y=−2

This answer graph shows the x y-coordinate plane. The x and y-axis each run from -6 to 6.  The equation x plus y equals -2 is  shown. A line passes through the intercepts with coordinates 0, –2 and –2, 0.

Choose the Most Convenient Method to Graph a Line

In the following exercises, identify the most convenient method to graph each line.

x=5

y=−3

horizontal line

2x+y=5

xy=2

intercepts

y=12x+2

y=34x1

plotting points

Understand Slope of a Line

Use Geoboards to Model Slope

In the following exercises, find the slope modeled on each geoboard.

The figure shows a grid of evenly spaced dots. There are 5 rows and 5 columns. There is a rubber band style loop connecting the point in column 1 row 4 and the point in column 4 row 2.
The figure shows a grid of evenly spaced dots. There are 5 rows and 5 columns. There is a rubber band style loop connecting the point in column 1 row 5 and the point in column 4 row 1.

43

The figure shows a grid of evenly spaced dots. There are 5 rows and 5 columns. There is a rubber band style loop connecting the point in column 1 row 3 and the point in column 4 row 4.
The figure shows a grid of evenly spaced dots. There are 5 rows and 5 columns. There is a rubber band style loop connecting the point in column 1 row 2 and the point in column 4 row 4.

23

In the following exercises, model each slope. Draw a picture to show your results.
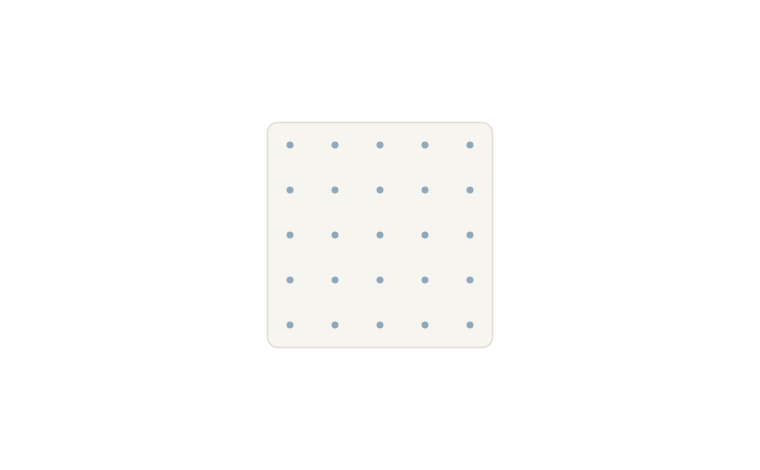
13

32

The figure shows a grid of evenly spaced dots. There are 5 rows and 5 columns. There is a rubber band style loop connecting the point in column 1 row 5 and the point in column 3 row 2.

23

12

The figure shows a grid of evenly spaced dots. There are 5 rows and 5 columns. There is a rubber band style loop connecting the point in column 1 row 2 and the point in column 3 row 3.

Find the Slope of a Line from its Graph

In the following exercises, find the slope of each line shown.
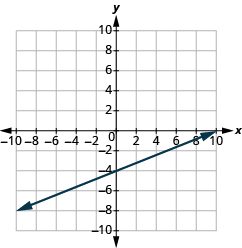
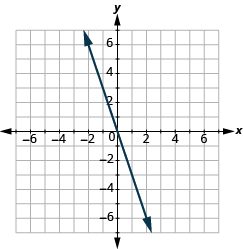
The graph shows the x y-coordinate plane. The axes run from -7 to 7. A line passes through the points “ordered pair 0,  0” and “ordered pair 2, -6”.
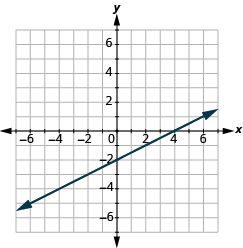
The graph shows the x y-coordinate plane. The axes run from -7 to 7. A line passes through the points “ordered pair 0,  4” and “ordered pair -4, 0”.

1

The graph shows the x y-coordinate plane. The axes run from -7 to 7. A line passes through the points “ordered pair -4,  -4” and “ordered pair 5, -1”.
The graph shows the x y-coordinate plane. The axes run from -7 to 7. A line passes through the points “ordered pair -3,  6” and “ordered pair 5, 2”.

12

Find the Slope of Horizontal and Vertical Lines

In the following exercises, find the slope of each line.

y=2

x=5

undefined

x=−3

y=−1

0

Use the Slope Formula to find the Slope of a Line between Two Points

In the following exercises, use the slope formula to find the slope of the line between each pair of points.

(2,1),(4,5)

(−1,−1),(0,−5)

−4

(3,5),(4,−1)

(−5,−2),(3,2)

12

Graph a Line Given a Point and the Slope

In the following exercises, graph the line given a point and the slope.
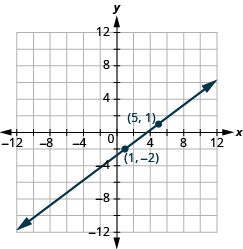
(2,−2);m=52

(−3,4);m=13

The graph shows the x y-coordinate plane. The x-axis runs from -6 to 6. The y-axis runs from -4 to 2. A line passes through the points “ordered pair -3,  4” and “ordered pair 1, 3”.

Solve Slope Applications

In the following exercise, solve the slope application.

A roof has rise 10 feet and run 15 feet. What is its slope?

Chapter Practice Test

Plot and label these points:

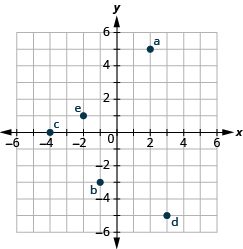
  1. (2,5)
  2. (−1,−3)
  3. (−4,0)
  4. (3,−5)
  5. (−2,1)

The graph shows the x y-coordinate plane. The axes extend from -6 to 6. a is plotted at 2, 5, b at -1, -3, c at -4, 0, d at 3, -5, and e at -2,1.

Name the ordered pair for each point shown.
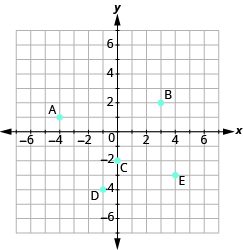
The graph shows the x y-coordinate plane. The axes extend from -7 to 7. A is plotted at -4, 1, B at 3, 2, C at 0, -2, D at -1, -4, and E at 4,-3.

Find the x-intercept and y-intercept on the line shown.

 The graph shows the x y-coordinate plane. The x-axis runs from -7 to 7. The y-axis runs from -7 to 7. A line passes through the points “ordered pair 4,  0” and “ordered pair 0, -2”.

(4,0), (0,−2)

Find the x-intercept and y-intercept of the equation 3xy=6.

Is (1,3) a solution to the equation x+4y=12? How do you know?

no; 1 + 4 · 3 ≠ 12

Complete the table to find four solutions to the equation y=x+1.

xy(x,y)
0
1
3
−2

Complete the table to find three solutions to the equation 4x+y=8

xy(x,y)
0
0
3
xy(x,y)
08(0,8)
20(2,0)
3−4(3,−4)

In the following exercises, find three solutions to each equation and then graph each line.
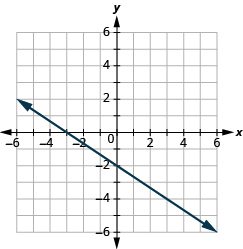
y=−3x

2x+3y=−6

 The graph shows the x y-coordinate plane. The x-axis runs from -6 to 6. The y-axis runs from -6 to 6. A line passes through the points “ordered pair 0,  -2” and “ordered pair -3, 0”.

In the following exercises, find the slope of each line.
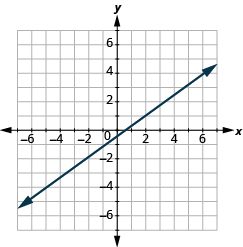
The graph shows the x y-coordinate plane. The axes run from -7 to 7. The y-axis runs from -5 to -4. A line passes through the points “ordered pair 6,  4” and “ordered pair 0, -3”.
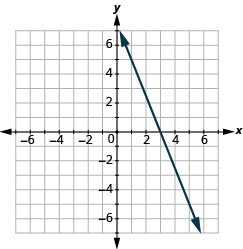
The graph shows the x y-coordinate plane. The axes run from -7 to 7. A line passes through the points “ordered pair 3,  0” and “ordered pair 1, 5”.

52

Use the slope formula to find the slope of the line between (0,−4) and (5,2).

Find the slope of the line y=2.

0

Graph the line passing through (1,1) with slope m=32.

A bicycle route climbs 20 feet for 1,000 feet of horizontal distance. What is the slope of the route?

150