
11.2 Use the Rectangular Coordinate System
Plot Points on a Rectangular Coordinate System
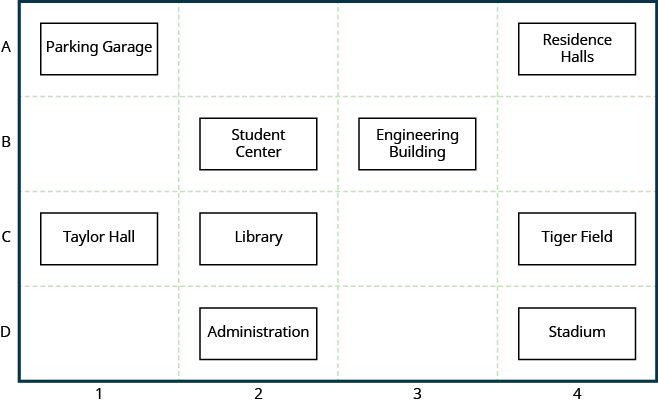
Many maps, such as the Campus Map shown in Figure 11.2, use a grid system to identify locations. Do you see the numbers and across the top and bottom of the map and the letters A, B, C, and D along the sides? Every location on the map can be identified by a number and a letter.
For example, the Student Center is in section 2B. It is located in the grid section above the number and next to the letter B. In which grid section is the Stadium? The Stadium is in section 4D.
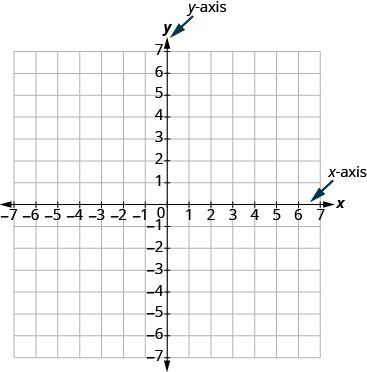
Just as maps use a grid system to identify locations, a grid system is used in algebra to show a relationship between two variables in a rectangular coordinate system. To create a rectangular coordinate system, start with a horizontal number line. Show both positive and negative numbers as you did before, using a convenient scale unit. This horizontal number line is called the x-axis.

Now, make a vertical number line passing through the at Put the positive numbers above and the negative numbers below See Figure 11.3. This vertical line is called the y-axis.
Vertical grid lines pass through the integers marked on the Horizontal grid lines pass through the integers marked on the The resulting grid is the rectangular coordinate system.
The rectangular coordinate system is also called the plane, the coordinate plane, or the Cartesian coordinate system (since it was developed by a mathematician named René Descartes.)
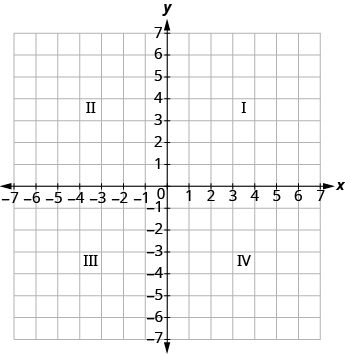
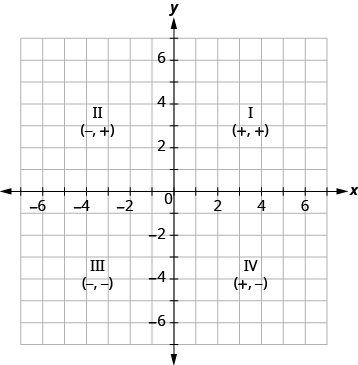
The and the form the rectangular coordinate system. These axes divide a plane into four areas, called quadrants. The quadrants are identified by Roman numerals, beginning on the upper right and proceeding counterclockwise. See Figure 11.4.
In the rectangular coordinate system, every point is represented by an ordered pair. The first number in the ordered pair is the x-coordinate of the point, and the second number is the y-coordinate of the point.
So how do the coordinates of a point help you locate a point on the plane?
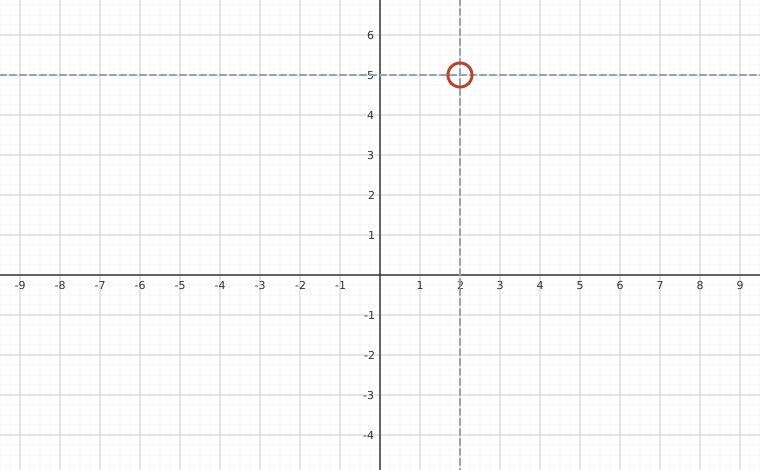
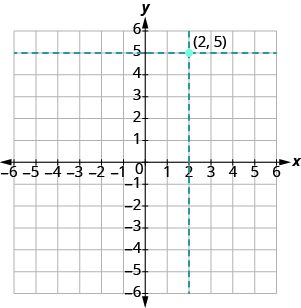
Let’s try locating the point . In this ordered pair, the -coordinate is and the -coordinate is .
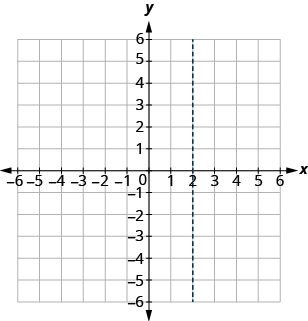
We start by locating the value, on the Then we lightly sketch a vertical line through as shown in Figure 11.5.
Now we locate the value, on the -axis and sketch a horizontal line through . The point where these two lines meet is the point with coordinates We plot the point there, as shown in Figure 11.6.
How do the signs affect the location of the points?
You may have noticed some patterns as you graphed the points in the two previous examples.
For each point in Quadrant IV, what do you notice about the signs of the coordinates?
What about the signs of the coordinates of the points in the third quadrant? The second quadrant? The first quadrant?
Can you tell just by looking at the coordinates in which quadrant the point (−2, 5) is located? In which quadrant is (2, −5) located?
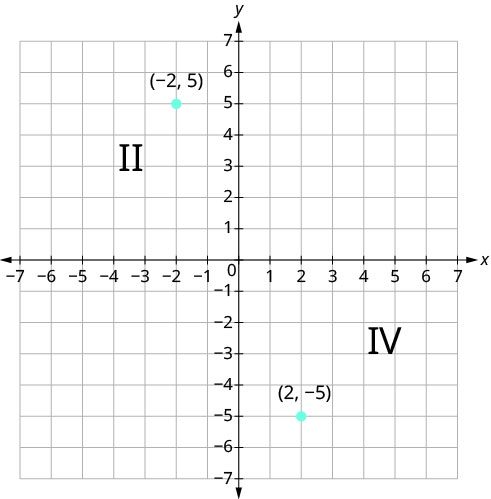
We can summarize sign patterns of the quadrants as follows. Also see Figure 11.8.
| Quadrant I | Quadrant II | Quadrant III | Quadrant IV |
|---|---|---|---|
| (x,y) | (x,y) | (x,y) | (x,y) |
| (+,+) | (−,+) | (−,−) | (+,−) |
What if one coordinate is zero? Where is the point located? Where is the point located? The point is on the y-axis and the point is on the x-axis.
Identify Points on a Graph
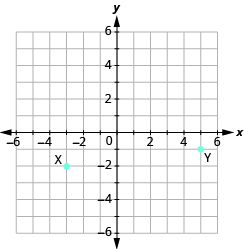
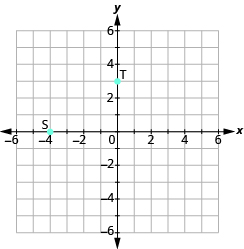
In algebra, being able to identify the coordinates of a point shown on a graph is just as important as being able to plot points. To identify the x-coordinate of a point on a graph, read the number on the x-axis directly above or below the point. To identify the y-coordinate of a point, read the number on the y-axis directly to the left or right of the point. Remember, to write the ordered pair using the correct order
Verify Solutions to an Equation in Two Variables
All the equations we solved so far have been equations with one variable. In almost every case, when we solved the equation we got exactly one solution. The process of solving an equation ended with a statement such as Then we checked the solution by substituting back into the equation.
Here’s an example of a linear equation in one variable, and its one solution.
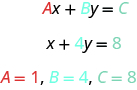
But equations can have more than one variable. Equations with two variables can be written in the general form An equation of this form is called a linear equation in two variables.
Notice that the word “line” is in linear.
Here is an example of a linear equation in two variables, and
Is a linear equation? It does not appear to be in the form But we could rewrite it in this form.
 | |
|---|---|
| Add to both sides. | 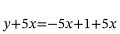 |
| Simplify. |  |
| Use the Commutative Property to put it in | 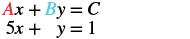 |
By rewriting as we can see that it is a linear equation in two variables because it can be written in the form
Linear equations in two variables have infinitely many solutions. For every number that is substituted for there is a corresponding value. This pair of values is a solution to the linear equation and is represented by the ordered pair When we substitute these values of and into the equation, the result is a true statement because the value on the left side is equal to the value on the right side.
Complete a Table of Solutions to a Linear Equation
In the previous examples, we substituted the of a given ordered pair to determine whether or not it was a solution to a linear equation. But how do we find the ordered pairs if they are not given? One way is to choose a value for and then solve the equation for Or, choose a value for and then solve for
We’ll start by looking at the solutions to the equation we found in Example 9. We can summarize this information in a table of solutions.
To find a third solution, we’ll let and solve for
 |  |
| Multiply. | |
| Simplify. |
The ordered pair is a solution to . We will add it to the table.
We can find more solutions to the equation by substituting any value of or any value of and solving the resulting equation to get another ordered pair that is a solution. There are an infinite number of solutions for this equation.
Find Solutions to Linear Equations in Two Variables
To find a solution to a linear equation, we can choose any number we want to substitute into the equation for either or We could choose or any other value we want. But it’s a good idea to choose a number that’s easy to work with. We’ll usually choose as one of our values.
We said that linear equations in two variables have infinitely many solutions, and we’ve just found one of them. Let’s find some other solutions to the equation
Let’s find some solutions to another equation now.
Key Concepts
- Sign Patterns of the Quadrants
Quadrant I Quadrant II Quadrant III Quadrant IV (x,y) (x,y) (x,y) (x,y) (+,+) (−,+) (−,−) (+,−) - Coordinates of Zero
- Points with a y-coordinate equal to 0 are on the x-axis, and have coordinates ( a, 0).
- Points with a x-coordinate equal to 0 are on the y-axis, and have coordinates ( 0, b).
- The point (0, 0) is called the origin. It is the point where the x-axis and y-axis intersect.
Practice Makes Perfect
Plot Points on a Rectangular Coordinate System
In the following exercises, plot each point on a coordinate grid.
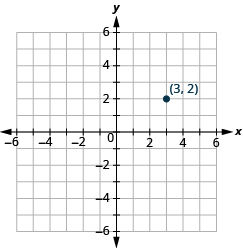
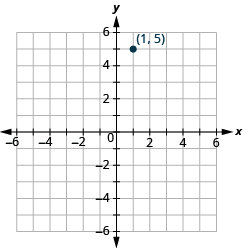
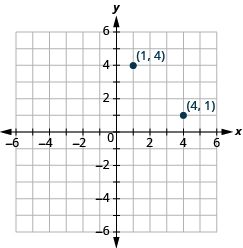
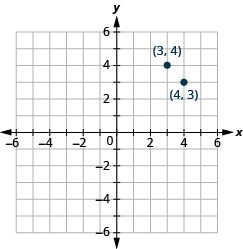
In the following exercises, plot each point on a coordinate grid and identify the quadrant in which the point is located.
- ⓐ
- ⓑ
- ⓒ
- ⓓ
- ⓐ
- ⓑ
- ⓒ
- ⓓ
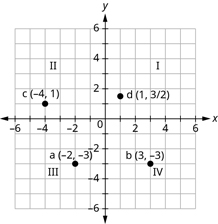
- ⓐ
- ⓑ
- ⓒ
- ⓓ
In the following exercises, plot each point on a coordinate grid.
- ⓐ
- ⓑ
- ⓒ
- ⓓ
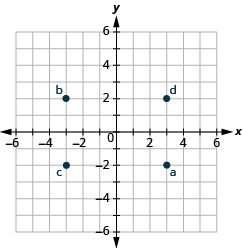
- ⓐ
- ⓑ
- ⓒ
- ⓓ
- ⓐ
- ⓑ
- ⓒ
- ⓓ
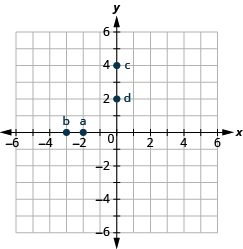
Identify Points on a Graph
In the following exercises, name the ordered pair of each point shown.
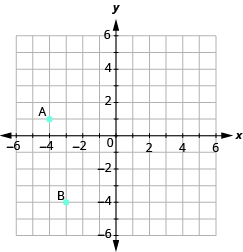
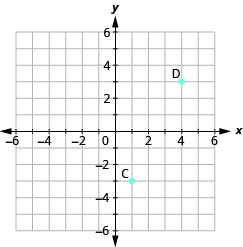
C(1, -3) D(4, 3)
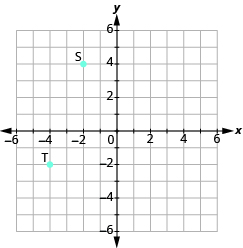
S(-2, 4) T(-4, -2)
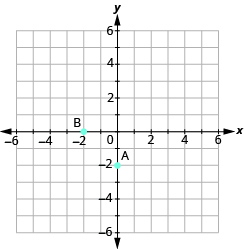
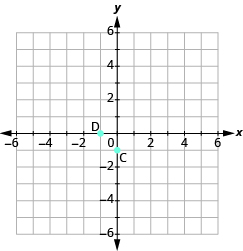
C(0, -1) D(-1, 0)
Verify Solutions to an Equation in Two Variables
In the following exercises, determine which ordered pairs are solutions to the given equation.
- ⓐ
- ⓑ
- ⓒ
ⓐ, ⓑ
- ⓐ
- ⓑ
- ⓒ
- ⓐ
- ⓑ
- ⓒ
ⓐ, ⓒ
- ⓐ
- ⓑ
- ⓒ
- ⓐ
- ⓑ
- ⓒ
ⓑ, ⓒ
- ⓐ
- ⓑ
- ⓒ
- ⓐ
- ⓑ
- ⓒ
ⓐ, ⓑ
- ⓐ
- ⓑ
- ⓒ
Find Solutions to Linear Equations in Two Variables
In the following exercises, complete the table to find solutions to each linear equation.
Everyday Math
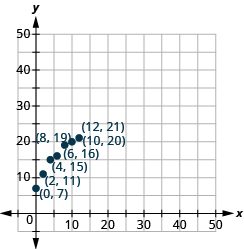
Weight of a baby Mackenzie recorded her baby’s weight every two months. The baby’s age, in months, and weight, in pounds, are listed in the table, and shown as an ordered pair in the third column.
ⓐ Plot the points on a coordinate grid.
ⓑ Why is only Quadrant I needed?
- ⓐ
- ⓑ Age and weight are only positive.
Weight of a child Latresha recorded her son’s height and weight every year. His height, in inches, and weight, in pounds, are listed in the table, and shown as an ordered pair in the third column.
ⓐ Plot the points on a coordinate grid.
ⓑ Why is only Quadrant I needed?
Writing Exercises
Have you ever used a map with a rectangular coordinate system? Describe the map and how you used it.
Answers may vary.
How do you determine if an ordered pair is a solution to a given equation?
Self Check
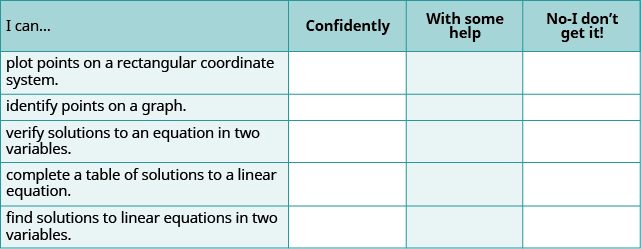
ⓐ After completing the exercises, use this checklist to evaluate your mastery of the objectives of this section.
ⓑ If most of your checks were:
…confidently. Congratulations! You have achieved the objectives in this section. Reflect on the study skills you used so that you can continue to use them. What did you do to become confident of your ability to do these things? Be specific.
…with some help. This must be addressed quickly because topics you do not master become potholes in your road to success. In math, every topic builds upon previous work. It is important to make sure you have a strong foundation before you move on. Whom can you ask for help? Your fellow classmates and instructor are good resources. Is there a place on campus where math tutors are available? Can your study skills be improved?
…no—I don’t get it! This is a warning sign and you must not ignore it. You should get help right away or you will quickly be overwhelmed. See your instructor as soon as you can to discuss your situation. Together you can come up with a plan to get you the help you need.
Adapted from Prealgebra 2e by OpenStax (openstax.org), licensed under CC BY-NC-SA 4.0. Changes were made. License: CC-BY-NC-SA-4.0.