
11.4 Graphing with Intercepts
Identify the Intercepts on a Graph
Every linear equation has a unique line that represents all the solutions of the equation. When graphing a line by plotting points, each person who graphs the line can choose any three points, so two people graphing the line might use different sets of points.
At first glance, their two lines might appear different since they would have different points labeled. But if all the work was done correctly, the lines will be exactly the same line. One way to recognize that they are indeed the same line is to focus on where the line crosses the axes. Each of these points is called an intercept of the line.
Let’s look at the graph of the lines shown in Figure 11.17.
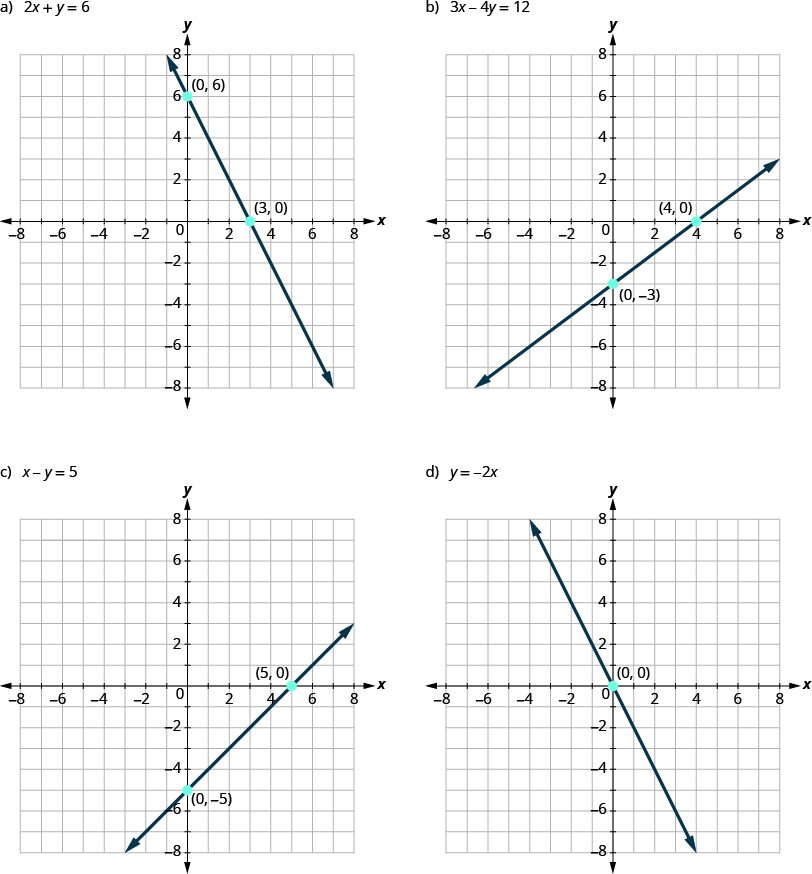
First, notice where each of these lines crosses the x- axis:
| Figure: | The line crosses the x-axis at: | Ordered pair of this point |
|---|---|---|
| 42 | 3 | (3,0) |
| 43 | 4 | (4,0) |
| 44 | 5 | (5,0) |
| 45 | 0 | (0,0) |
Do you see a pattern?
For each row, the y- coordinate of the point where the line crosses the x- axis is zero. The point where the line crosses the x- axis has the form ; and is called the x-intercept of the line. The x- intercept occurs when y is zero.
Now, let's look at the points where these lines cross the y-axis.
| Figure: | The line crosses the y-axis at: | Ordered pair for this point |
|---|---|---|
| 42 | 6 | (0,6) |
| 43 | -3 | (0,-3) |
| 44 | -5 | (0,-5) |
| 45 | 0 | (0,0) |
Find the Intercepts from an Equation of a Line
Recognizing that the occurs when is zero and that the occurs when is zero gives us a method to find the intercepts of a line from its equation. To find the let and solve for To find the let and solve for
Graph a Line Using the Intercepts
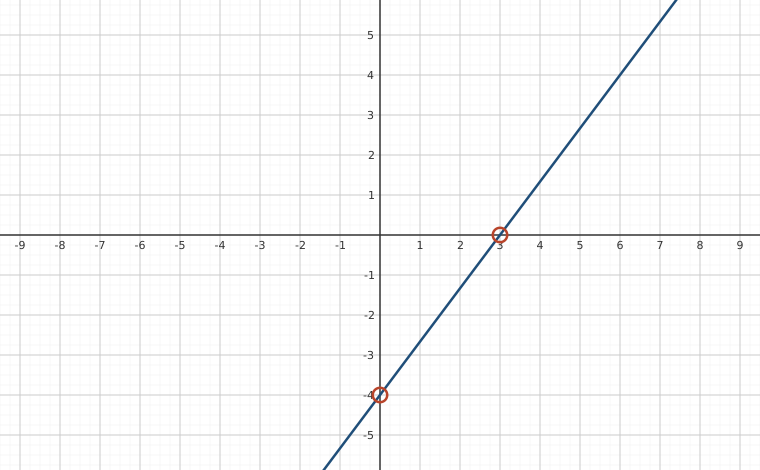
To graph a linear equation by plotting points, you can use the intercepts as two of your three points. Find the two intercepts, and then a third point to ensure accuracy, and draw the line. This method is often the quickest way to graph a line.
Choose the Most Convenient Method to Graph a Line
While we could graph any linear equation by plotting points, it may not always be the most convenient method. This table shows six of the equations we’ve graphed in this chapter, and the methods we used to graph them.
| Equation | Method | |
|---|---|---|
| #1 | Plotting points | |
| #2 | Plotting points | |
| #3 | Vertical line | |
| #4 | Horizontal line | |
| #5 | Intercepts | |
| #6 | Intercepts |
What is it about the form of equation that can help us choose the most convenient method to graph its line?
Notice that in equations #1 and #2, y is isolated on one side of the equation, and its coefficient is 1. We found points by substituting values for x on the right side of the equation and then simplifying to get the corresponding y- values.
Equations #3 and #4 each have just one variable. Remember, in this kind of equation the value of that one variable is constant; it does not depend on the value of the other variable. Equations of this form have graphs that are vertical or horizontal lines.
In equations #5 and #6, both x and y are on the same side of the equation. These two equations are of the form . We substituted and to find the x- and y- intercepts, and then found a third point by choosing a value for x or y.
This leads to the following strategy for choosing the most convenient method to graph a line.
Key Concepts
- Intercepts
- The x-intercept is the point, , where the graph crosses the x-axis. The x-intercept occurs when y is zero.
- The y-intercept is the point, , where the graph crosses the y-axis. The y-intercept occurs when x is zero.
- The x-intercept occurs when y is zero.
- The y-intercept occurs when x is zero.
- Find the x and y intercepts from the equation of a line
- To find the x-intercept of the line, let and solve for x.
- To find the y-intercept of the line, let and solve for y.
x y 0 0
- Graph a line using the intercepts
- Find the x- and y- intercepts of the line.
- Let and solve for x.
- Let and solve for y.
- Find a third solution to the equation.
- Plot the three points and then check that they line up.
- Draw the line.
- Find the x- and y- intercepts of the line.
- Choose the most convenient method to graph a line
- Determine if the equation has only one variable. Then it is a vertical or horizontal line.
is a vertical line passing through the x-axis at a.
is a horizontal line passing through the y-axis at b. - Determine if y is isolated on one side of the equation. The graph by plotting points.
Choose any three values for x and then solve for the corresponding y- values. - Determine if the equation is of the form , find the intercepts.
Find the x- and y- intercepts and then a third point.
- Determine if the equation has only one variable. Then it is a vertical or horizontal line.
Practice Makes Perfect
Identify the Intercepts on a Graph
In the following exercises, find the and intercepts.
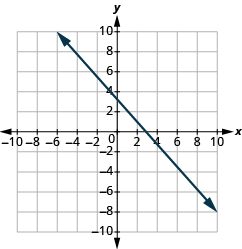
(3,0),(0,3)
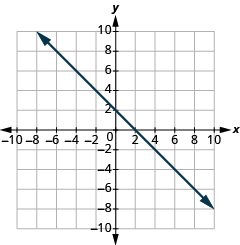
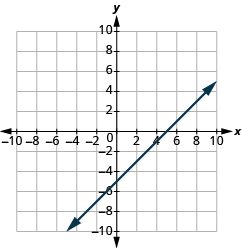
(5,0),(0,−5)
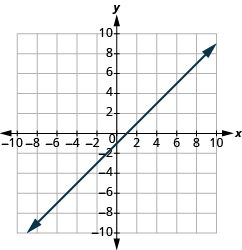
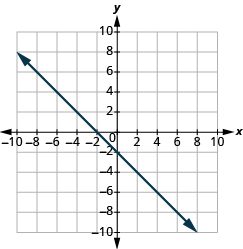
(−2,0),(0,−2)
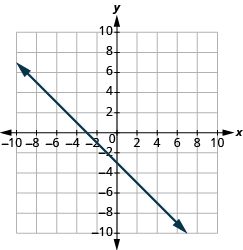
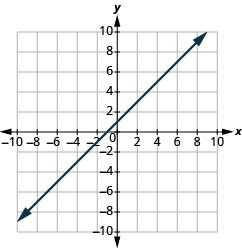
(−1,0),(0,1)
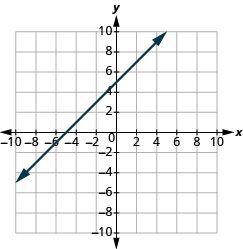
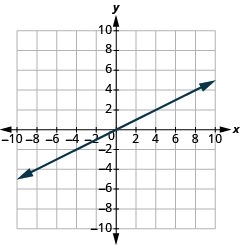
(0,0)
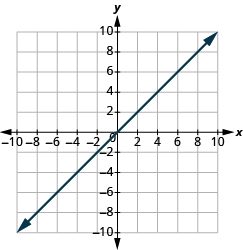
Find the and Intercepts from an Equation of a Line
In the following exercises, find the intercepts.
(4,0),(0,4)
(−2,0),(0,−2)
(5,0),(0,−5)
(−3,0),(0,3)
(8,0),(0,4)
(2,0),(0,6)
(12,0),(0,−4)
(2,0),(0,−8)
(5,0),(0,2)
(4,0),(0,−6)
(3,0),(0,−1)
(−10,0),(0,2)
(0,0)
(0,0)
Graph a Line Using the Intercepts
In the following exercises, graph using the intercepts.
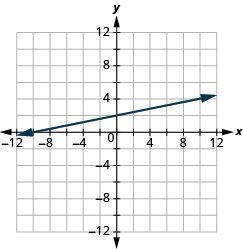
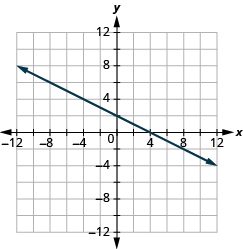
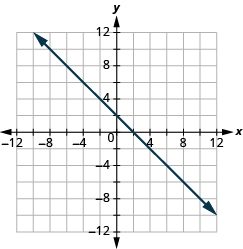
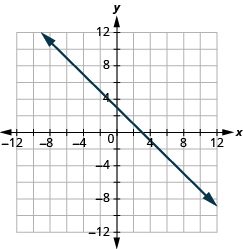
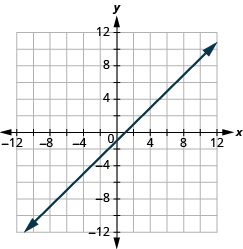
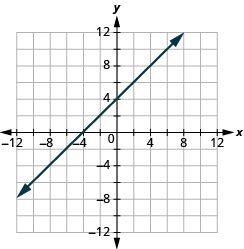
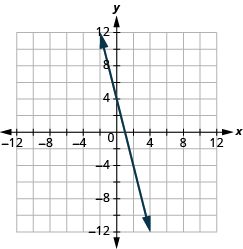
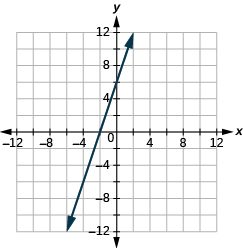
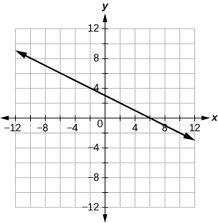
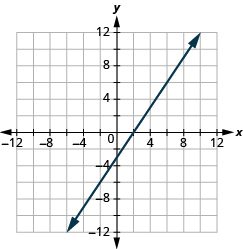
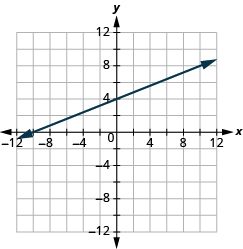
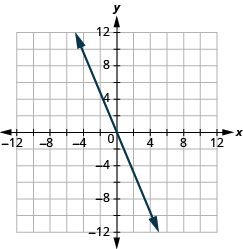
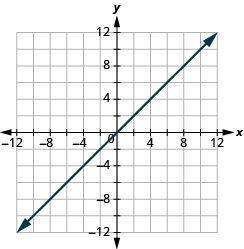
Choose the Most Convenient Method to Graph a Line
In the following exercises, identify the most convenient method to graph each line.
vertical line
horizontal line
plotting points
intercepts
plotting points
horizontal line
intercepts
plotting points
Everyday Math
Road trip Damien is driving from Chicago to Denver, a distance of miles. The on the graph below shows the time in hours since Damien left Chicago. The represents the distance he has left to drive.
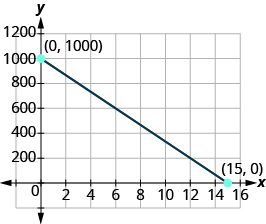
ⓐ Find the and intercepts
ⓑ Explain what the and intercepts mean for Damien.
ⓐ (0,1,000),(15,0). ⓑ At (0,1,000) he left Chicago 0 hours ago and has 1,000 miles left to drive. At (15,0) he left Chicago 15 hours ago and has 0 miles left to drive.
Road trip Ozzie filled up the gas tank of his truck and went on a road trip. The on the graph shows the number of miles Ozzie drove since filling up. The represents the number of gallons of gas in the truck’s gas tank.
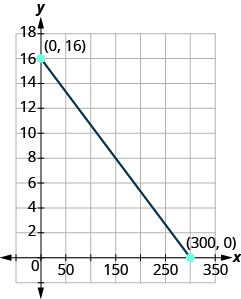
ⓐ Find the and intercepts.
ⓑ Explain what the and intercepts mean for Ozzie.
Writing Exercises
How do you find the of the graph of
Answers will vary.
How do you find the of the graph of
Do you prefer to graph the equation by plotting points or intercepts? Why?
Answers will vary.
Do you prefer to graph the equation by plotting points or intercepts? Why?
Self Check
ⓐ After completing the exercises, use this checklist to evaluate your mastery of the objectives of this section.
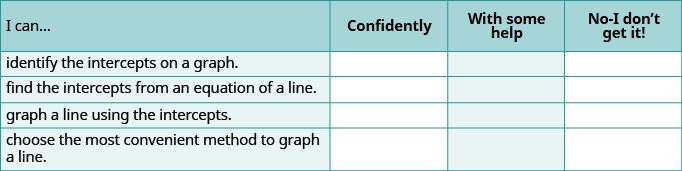
ⓑ What does this checklist tell you about your mastery of this section? What steps will you take to improve?
Adapted from Prealgebra 2e by OpenStax (openstax.org), licensed under CC BY-NC-SA 4.0. Changes were made. License: CC-BY-NC-SA-4.0.