Login
📚 Prealgebra 2e
Chapters ▾
⇩ Download ▾

11.3 Graphing Linear Equations

Recognize the Relation Between the Solutions of an Equation and its Graph

In Use the Rectangular Coordinate System, we found a few solutions to the equation 3x+2y=6. They are listed in the table below. So, the ordered pairs (0,3), (2,0), (1,32), (4,3), are some solutions to the equation3x+2y=6. We can plot these solutions in the rectangular coordinate system as shown on the graph at right.
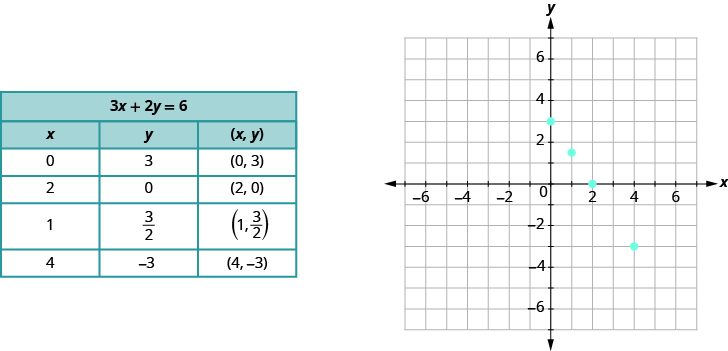
The image shows a table breaking up points by their x components and y components. These points are then mapped onto a graph. Points include (0, 3), (2, 0), (1, 3/2), and (4, –3).

Notice how the points line up perfectly? We connect the points with a straight line to get the graph of the equation 3x+2y=6. Notice the arrows on the ends of each side of the line. These arrows indicate the line continues.
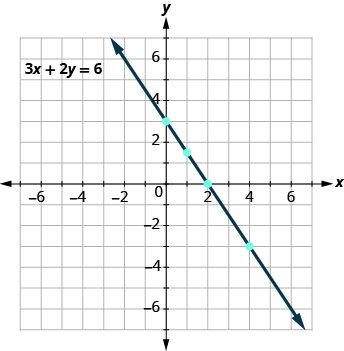
A graph displays the linear equation 3x + 2y = 6. The line passes through points such as (0, 3), (2, 0), and (3, -1.5), demonstrating its downward slope on a Cartesian coordinate system.

Every point on the line is a solution of the equation. Also, every solution of this equation is a point on this line. Points not on the line are not solutions!

Notice that the point whose coordinates are (2,6) is on the line shown in Figure 11.10. If you substitute x=2 and y=6 into the equation, you find that it is a solution to the equation.
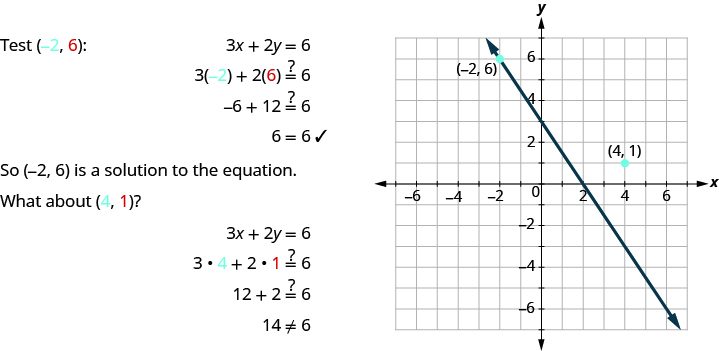
The image shows the process of testing point (–2, 6) as a solution to the given equation. Graphing it out, the line properly intercepts this point but does not intercept point (4, 1) which was also tested but failed with the equation.
Figure 11.10

So (4,1) is not a solution to the equation 3x+2y=6. Therefore the point (4,1) is not on the line.

This is an example of the saying,” A picture is worth a thousand words.” The line shows you all the solutions to the equation. Every point on the line is a solution of the equation. And, every solution of this equation is on this line. This line is called the graph of the equation 3x+2y=6.

Graph a Linear Equation by Plotting Points

There are several methods that can be used to graph a linear equation. The method we used at the start of this section to graph is called plotting points, or the Point-Plotting Method.

Let’s graph the equation y=2x+1 by plotting points.

We start by finding three points that are solutions to the equation. We can choose any value for x or y, and then solve for the other variable.
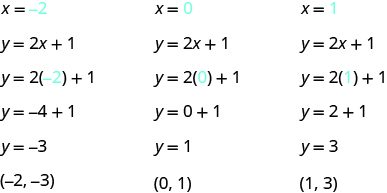
Since y is isolated on the left side of the equation, it is easier to choose values for x. We will use 0,1, and -2 for x for this example. We substitute each value of x into the equation and solve for y.

The figure shows three algebraic substitutions into an equation. The first substitution is for x = -2, with -2 shown in blue. The next line is y = 2 x + 1. The next line is y = 2 open parentheses -2, shown in blue, closed parentheses, + 1. The next line is y = - 4 + 1. The next line is y = -3. The last line is “ordered pair -2, -3”. The second  substitution is for x = 0, with 0 shown in blue. The next line is y = 2 x + 1. The next line is y = 2 open parentheses 0, shown in blue, closed parentheses, + 1. The next line is y = 0 + 1. The next line is y = 1. The last line is “ordered pair 0, 2”. The third substitution is for x = 1, with 1 shown in blue. The next line is y = 2 x + 1. The next line is y = 2 open parentheses 1, shown in blue, closed parentheses, + 1. The next line is y = 2 + 1. The next line is y = 3. The last line is “ordered pair -1, 3”.

We can organize the solutions in a table. See Table 11.2.

Table 11.2
y=2x+1
xy(x,y)
01(0,1)
13(1,3)
−2−3(−2,−3)

Now we plot the points on a rectangular coordinate system. Check that the points line up. If they did not line up, it would mean we made a mistake and should double-check all our work. See Figure 11.11.
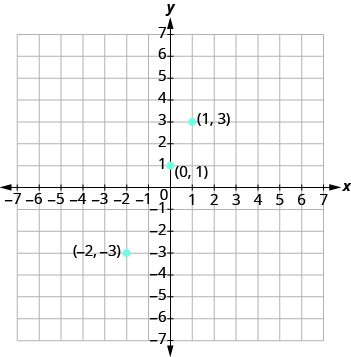
The graph shows the x y-coordinate plane. The x and y-axis each run from -7 to 7. Three labeled points are shown, “ordered pair -2, -3”, “ordered pair 0, 1”, and ordered pair 1, 3”.
Figure 11.11

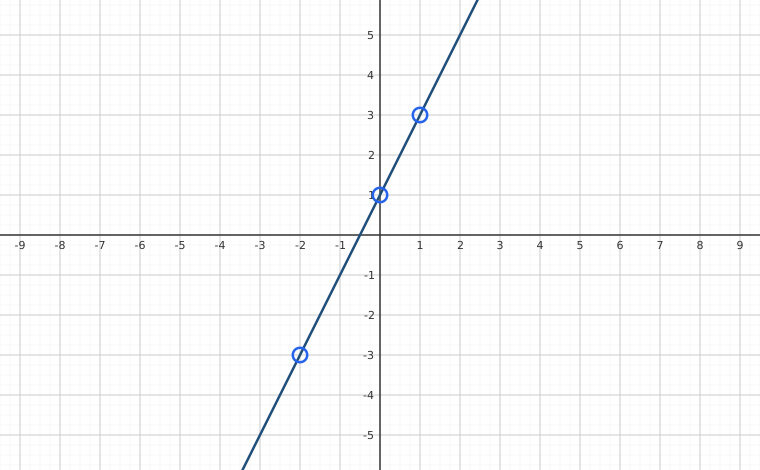
Draw the line through the three points. Extend the line to fill the grid and put arrows on both ends of the line. The line is the graph of y=2x+1.
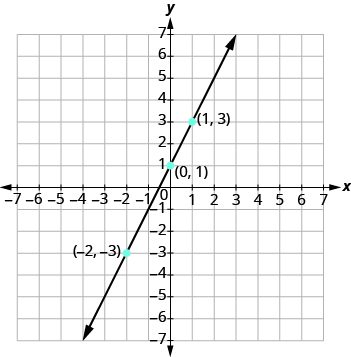
The graph shows the x y-coordinate plane. The x and y-axis each run from -7 to 7. A line passes through three labeled points, “ordered pair -2, -3”, “ordered pair 0, 1”, and ordered pair 1, 3”.
Figure 11.12

It is true that it only takes two points to determine a line, but it is a good habit to use three points. If you plot only two points and one of them is incorrect, you can still draw a line but it will not represent the solutions to the equation. It will be the wrong line. If you use three points, and one is incorrect, the points will not line up. This tells you something is wrong and you need to check your work. See Figure 11.13.
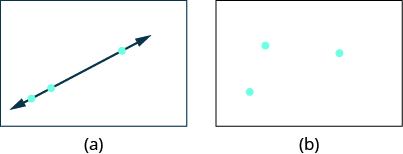
There are two figures. Figure a shows three points that are all contained on a straight line. There is a line with arrows that passed through the three points. Figure b shows 3 points that are not all arranged in a straight line.
Figure 11.13 Look at the difference between (a) and (b). All three points in (a) line up so we can draw one line through them. The three points in (b) do not line up. We cannot draw a single straight line through all three points.

When an equation includes a fraction as the coefficient of x, we can substitute any numbers for x. But the math is easier if we make ‘good’ choices for the values of x. This way we will avoid fraction answers, which are hard to graph precisely.

So far, all the equations we graphed had y given in terms of x. Now we’ll graph an equation with x and y on the same side.

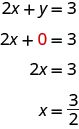
In the previous example, the three points we found were easy to graph. But this is not always the case. Let’s see what happens in the equation 2x+y=3. If y is 0, what is the value of x?

This figure shows an algebraic substitution. The first line is 2 x + y = 3. The second line is 2 x + 0, with 0 shown in red. The third line is 2 x = 3. The last line is x = 3 over 2.

The solution is the point (32,0). This point has a fraction for the x-coordinate. While we could graph this point, it is hard to be precise graphing fractions. Remember in the example y=12x+3, we carefully chose values for x so as not to graph fractions at all. If we solve the equation 2x+y=3 for y, it will be easier to find three solutions to the equation.

2x+y=3

y=−2x+3

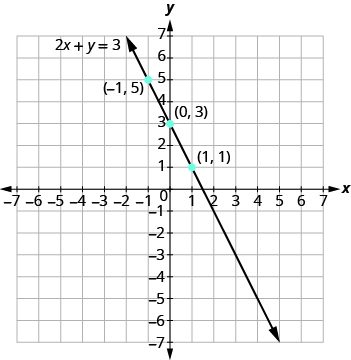
Now we can choose values for x that will give coordinates that are integers. The solutions for x=0,x=1, and x=−1 are shown.

y=−2x+3
xy(x,y)
03(0,3)
11(1,1)
−15(1,5)
The graph shows the x y-coordinate plane. The x and y-axis each run from -7 to 7. A line passes through three labeled points, “ordered pair -1, 5”, “ordered pair 0, 3”, and ordered pair 1, 1”. The line is labeled 2 x + y = 3.

Graph Vertical and Horizontal Lines

Can we graph an equation with only one variable? Just x and no y, or just y without an x? How will we make a table of values to get the points to plot?
Let’s consider the equation x=−3. The equation says that x is always equal to −3, so its value does not depend on y. No matter what y is, the value of x is always −3.

To make a table of solutions, we write −3 for all the x values. Then choose any values for y. Since x does not depend on y, you can choose any numbers you like. But to fit the size of our coordinate graph, we’ll use 1,2, and 3 for the y-coordinates as shown in the table.

x=−3
xy(x,y)
−31(−3,1)
−32(−3,2)
−33(−3,3)

Then plot the points and connect them with a straight line. Notice in Figure 11.14 that the graph is a vertical line.
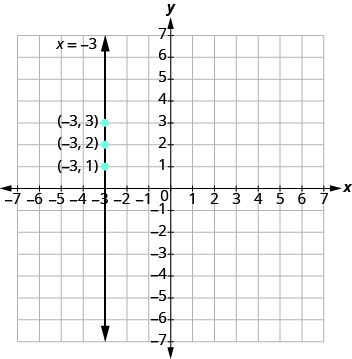
The graph shows the x y-coordinate plane. The x and y-axis each run from -7 to 7. A vertical line passes through three labeled points, “ordered pair -3, 3”, “ordered pair -3, 2”, and ordered pair -3, 1”. The line is labeled x = -3.
Figure 11.14

What if the equation has y but no x? Let’s graph the equation y=4. This time the y-value is a constant, so in this equation y does not depend on x.

To make a table of solutions, write 4 for all the y values and then choose any values for x.

We’ll use 0,2, and 4 for the x-values.

y=4
xy(x,y)
04(0,4)
24(2,4)
44(4,4)

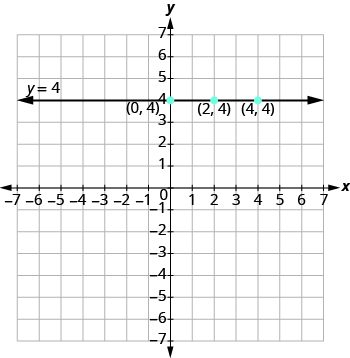
Plot the points and connect them, as shown in Figure 11.15. This graph is a horizontal line passing through the y-axis at 4.

The graph shows the x y-coordinate plane. The x and y-axis each run from -7 to 7. A horizontal  line passes through three labeled points, “ordered pair 0, 4”, “ordered pair 2, 4”, and ordered pair 4, 4”. The line is labeled y = 4.
Figure 11.15

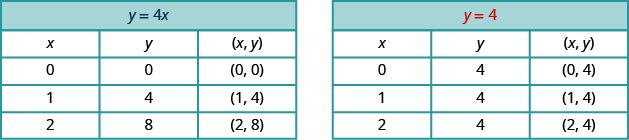
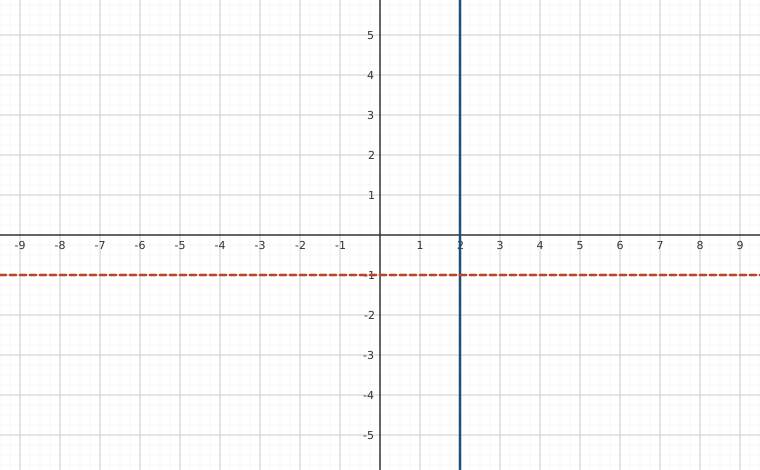
The equations for vertical and horizontal lines look very similar to equations like y=4x. What is the difference between the equations y=4x and y=4?

The equation y=4x has both x and y. The value of y depends on the value of x. The y-coordinate changes according to the value of x.

The equation y=4 has only one variable. The value of y is constant. The y-coordinate is always 4. It does not depend on the value of x.

There are two tables. This first table is titled y = 4 x, which is shown in blue. It has 4 rows and 3 columns. The first row is a header row and it labels each column “x”, “y”, and  “ordered pair x, y”. Under the column “x” are the values  0, 1, and 2. Under the column “y” are the values  0, 4, and 8. Under the column “ordered pair x, y” are the values “ordered pair 0, 0”, “ordered pair 1, 4”, and “ordered pair 2, 8”. This second table is titled y = 4 , which is shown in red. It has 4 rows and 3 columns. The first row is a header row and it labels each column “x”, “y”, and  “ordered pair x, y”. Under the column “x” are the values  0, 1, and 2. Under the column “y” are the values  4, 4, and 4. Under the column “ordered pair x, y” are the values “ordered pair 0, 4”, “ordered pair 1, 4”, and “ordered pair 2, 4”.

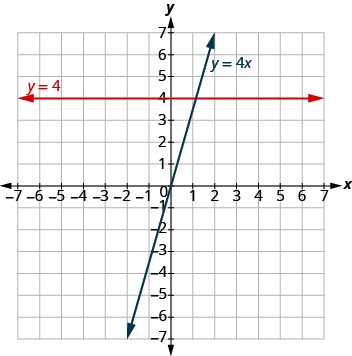
The graph shows both equations.

The graph shows the x y-coordinate plane. The x and y-axis each run from -7 to 7. A horizontal line passes through “ordered pair 0, 4” and “ordered pair 1, 4” and is labeled y = 4. A second line passes through “ordered pair 0, 0” and “ordered pair 1, 4” and is labeled y = 4 x. The two lines intersect at “ordered pair 1, 4”.

Notice that the equation y=4x gives a slanted line whereas y=4 gives a horizontal line.

Key Concepts

  • Graph a linear equation by plotting points.
    1. Find three points whose coordinates are solutions to the equation. Organize them in a table.
    2. Plot the points on a rectangular coordinate system. Check that the points line up. If they do not, carefully check your work.
    3. Draw the line through the points. Extend the line to fill the grid and put arrows on both ends of the line.
  • Graph of a Linear Equation:The graph of a linear equation ax+by=c is a straight line.
    • Every point on the line is a solution of the equation.
    • Every solution of this equation is a point on this line.

Practice Makes Perfect

Recognize the Relation Between the Solutions of an Equation and its Graph

In each of the following exercises, an equation and its graph is shown. For each ordered pair, decide

  1. ⓐ is the ordered pair a solution to the equation?
  2. ⓑ is the point on the line?

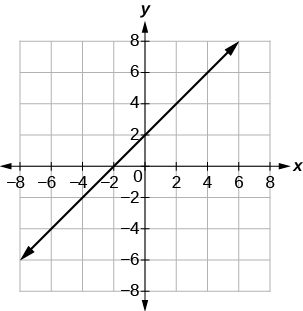
y=x+2

A graph with both x- and y-axis ranging from –8 to 8. A line runs upwards, intercepting the x-axis at (–2, 0) and the y-axis at (0, 2).

  1. (0,2)
  2. (1,2)
  3. (1,1)
  4. (3,1)
  1. ⓐ yes ⓑ yes
  2. ⓐ no ⓑ no
  3. ⓐ yes ⓑ yes
  4. ⓐ no ⓑ no

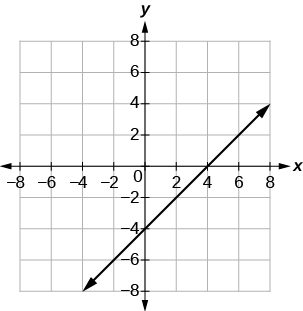
y=x4

A graph with both x- and y-axis running from –8 to 8. A line is drawn that intercepts the y-axis at (0, –4) and the x-axis at (4, 0)

  1. (0,4)
  2. (3,1)
  3. (2,2)
  4. (1,5)

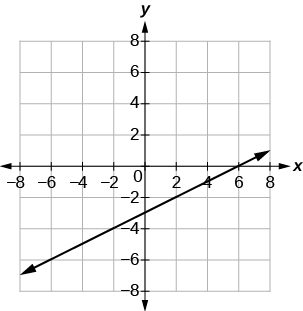
y=12x3

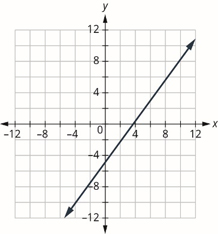
A graph with both x- and y-axis running from –8 to 8. A line is drawn that intercepts the y-axis at (0, –3) and the x-axis at (6, 0)

  1. (0,3)
  2. (2,2)
  3. (2,4)
  4. (4,1)
  1. ⓐ yes ⓑ yes
  2. ⓐ yes ⓑ yes
  3. ⓐ yes ⓑ yes
  4. ⓐ no ⓑ no

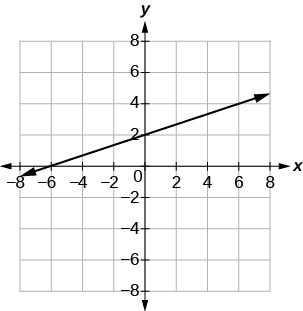
y=13x+2

A linear graph on a grid, showing a line with a positive slope, passing through y-intercept (0, 2) and x-intercept (-7, 0). The x and y axes range from -8 to 8.

  1. (0,2)
  2. (3,3)
  3. (3,2)
  4. (6,0)

Graph a Linear Equation by Plotting Points

In the following exercises, graph by plotting points.
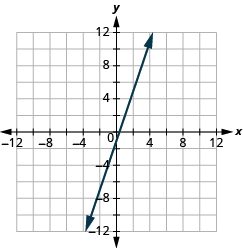
y=3x1

The graph shows the x y-coordinate plane. The x and y-axis each run from -12 to 12. A line passes through the points “ordered pair 0,  -1” and “ordered pair 1/3, 0”.

y=2x+3

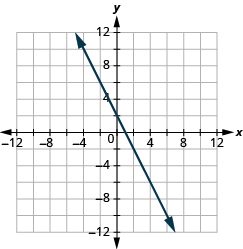
y=−2x+2

The graph shows the x y-coordinate plane. The x and y-axis each run from -12 to 12. A line passes through the points “ordered pair 0,  4” and “ordered pair 1, 0”.

y=−3x+1

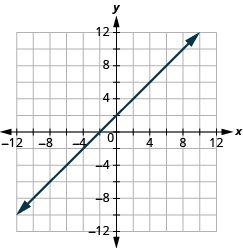
y=x+2

The graph shows the x y-coordinate plane. The x and y-axis each run from -12 to 12. A line passes through the points “ordered pair 0,  2” and “ordered pair 2, 4”.

y=x3

y=x3

The graph shows the x y-coordinate plane. The x and y-axis each run from -12 to 12. A line passes through the points “ordered pair 0,  -3” and “ordered pair 1, -4”.

y=x2

y=2x

The graph shows the x y-coordinate plane. The x and y-axis each run from -12 to 12. A line passes through the points “ordered pair 0,  0” and “ordered pair 2, 4”.

y=3x

y=−4x

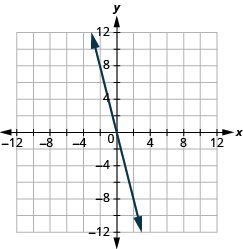
The graph shows the x y-coordinate plane. The x and y-axis each run from -12 to 12. A line passes through the points “ordered pair 0,  0” and “ordered pair 1, -4”.

y=−2x

y=12x+2

The graph shows the x y-coordinate plane. The x and y-axis each run from -12 to 12. A line passes through the points “ordered pair 0,  2” and “ordered pair 4, 4”.

y=13x1

y=43x5

The graph shows the x y-coordinate plane. The x and y-axis each run from -12 to 12. A line passes through the points “ordered pair 0,  5” and “ordered pair 4, 2”.

y=32x3

y=25x+1

The graph shows the x y-coordinate plane. The x and y-axis each run from -12 to 12. A line passes through the points “ordered pair 0,  1” and “ordered pair 8, -2”.

y=45x1

y=32x+2

The graph shows the x y-coordinate plane. The x and y-axis each run from -12 to 12. A line passes through the points “ordered pair 0,  2” and “ordered pair 4, -4”.

y=53x+4

x+y=6

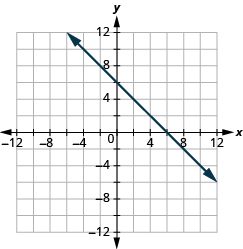
The graph shows the x y-coordinate plane. The x and y-axis each run from -12 to 12. A line passes through the points “ordered pair 0,  6” and “ordered pair 6, 0”.

x+y=4

x+y=−3

The graph shows the x y-coordinate plane. The x and y-axis each run from -12 to 12. A line passes through the points “ordered pair 0,  -3” and “ordered pair -3, 0”.

x+y=−2

xy=2

The graph shows the x y-coordinate plane. The x and y-axis each run from -12 to 12. A line passes through the points “ordered pair 0,  -2” and “ordered pair 2, 0”.

xy=1

xy=−1

The graph shows the x y-coordinate plane. The x and y-axis each run from -12 to 12. A line passes through the points “ordered pair 0,  1” and “ordered pair 8, 8”.

xy=−3

x+y=4

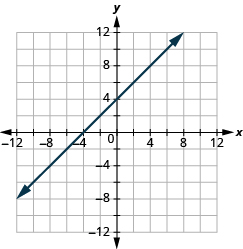
The graph shows the x y-coordinate plane. The x and y-axis each run from -12 to 12. A line passes through the points “ordered pair -4,  0” and “ordered pair 0, 4”.

x+y=3

xy=5

The graph shows the x y-coordinate plane. The x and y-axis each run from -12 to 12. A line passes through the points “ordered pair -5,  0” and “ordered pair 0, -5”.

xy=1

3x+y=7

The graph shows the x y-coordinate plane. The x and y-axis each run from -12 to 12. A line passes through the points “ordered pair 4,  -4” and “ordered pair 0, 8”.

5x+y=6

2x+y=−3

The graph shows the x y-coordinate plane. The x and y-axis each run from -12 to 12. A line passes through the points “ordered pair 0,  -3” and “ordered pair 2, -7”.

4x+y=−5

2x+3y=12

The graph shows the x y-coordinate plane. The x and y-axis each run from -12 to 12. A line passes through the points “ordered pair 0,  4” and “ordered pair 6, 0”.

3x4y=12

13x+y=2

The graph shows the x y-coordinate plane. The x and y-axis each run from -12 to 12. A line passes through the points “ordered pair 0,  2” and “ordered pair 6, 0”.

12x+y=3

Graph Vertical and Horizontal lines

In the following exercises, graph the vertical and horizontal lines.
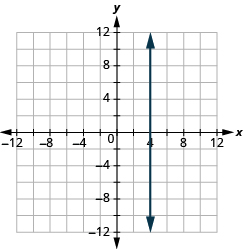
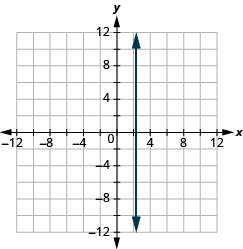
x=4

The graph shows the x y-coordinate plane. The x and y-axis each run from -12 to 12. A vertical line passes through the points “ordered pair 4,  0” and “ordered pair 4, 1”.

x=3

x=−2

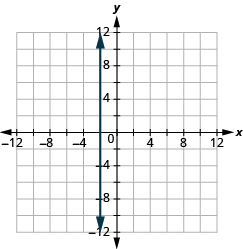
The graph shows the x y-coordinate plane. The x and y-axis each run from -12 to 12. A vertical line passes through the points “ordered pair -2,  0” and “ordered pair -2, 1”.

x=−5

y=3

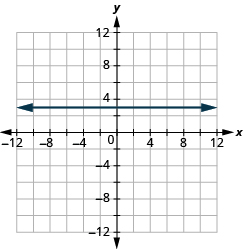
The graph shows the x y-coordinate plane. The x and y-axis each run from -12 to 12. A horizontal line passes through the points “ordered pair 0,  3” and “ordered pair 1, 3”.

y=1

y=−5

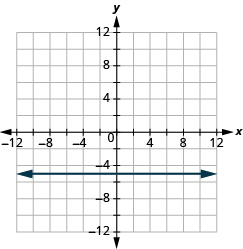
The graph shows the x y-coordinate plane. The x and y-axis each run from -12 to 12. A horizontal line passes through the points “ordered pair 0,  -5” and “ordered pair 1, -5”.

y=−2

x=73

The graph shows the x y-coordinate plane. The x and y-axis each run from -12 to 12. A vertical line passes through the points “ordered pair 7 over 3,  0” and “ordered pair 7 over 3 , 1”.

x=54

In the following exercises, graph each pair of equations in the same rectangular coordinate system.

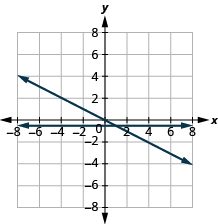
y=12x and y=12

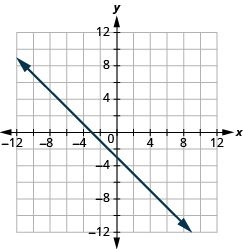
A Cartesian coordinate system displays a dark blue line that passes through the origin (0,0). The line has a negative slope, intersecting points like (-4, 2) and (4, -2).

y=13x and y=13

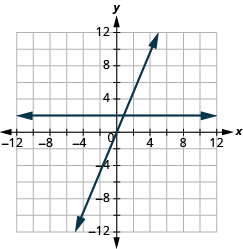
y=2x and y=2

The graph shows the x y-coordinate plane. The x and y-axis each run from -12 to 12. A horizontal line passes through “ordered pair 0, 2” and “ordered pair 1, 2” . A second line passes through “ordered pair 0, 0” and “ordered pair 1, 2” . The two lines intersect at “ordered pair 1, 2”.

y=5x and y=5

Mixed Practice

In the following exercises, graph each equation.
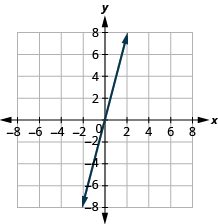
y=4x

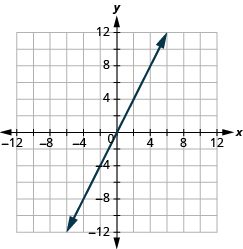
A coordinate plane shows a straight line passing through the origin (0,0) and the points (1,4) and (-1,-4), indicating a positive slope of 4.

y=2x

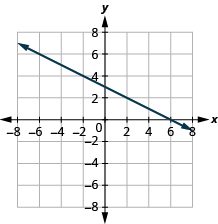
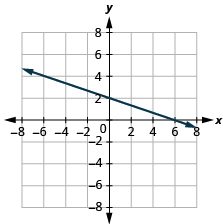
y=12x+3

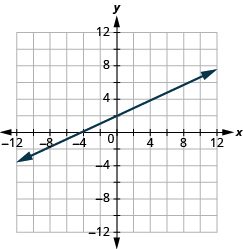
A graph displays a blue line with a negative slope on a Cartesian coordinate plane. The line intersects the y-axis at approximately 3.5 and the x-axis at approximately 7.

y=14x2

y=x

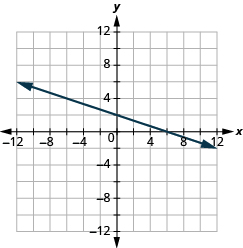
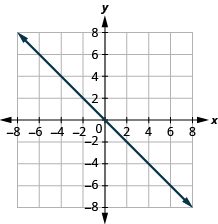
A line graph on a Cartesian plane showing a straight line passing through the origin (0,0) with a negative slope. The x and y axes range from -8 to 8.

y=x

xy=3

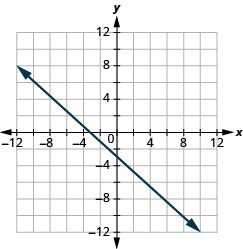
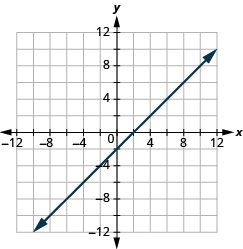
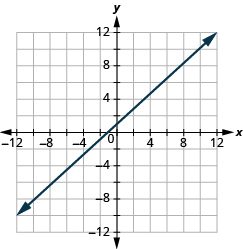
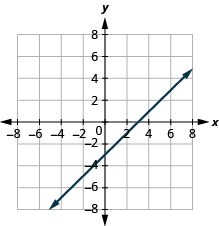
A graph showing a straight line on a Cartesian coordinate plane. The line has a positive slope, intersecting the y-axis at -3 and the x-axis at 4.5. It represents a linear function.

x+y=5

4x+y=2

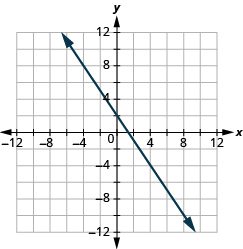
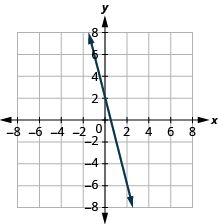
A graph shows a linear function, represented by a solid downward-sloping line, plotted on a Cartesian coordinate system. The line intersects the y-axis at (0, 2) and the x-axis at (1, 0), extending infinitely in both directions as indicated by arrows.

2x+y=6

y=−1

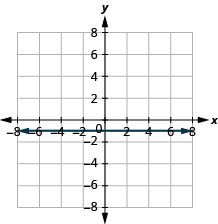
A Cartesian coordinate system with a grid. The x and y axes are labeled from -8 to 8. A horizontal double-headed arrow is drawn along the x-axis, indicating the entire range.

y=5

2x+6y=12

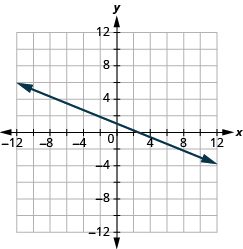
A graph on a coordinate plane shows a downward-sloping line. The line intersects the y-axis at (0, 2) and the x-axis at (6, 0), extending infinitely in both directions.

5x+2y=10

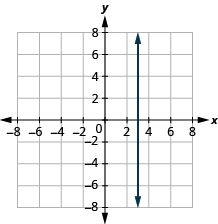
x=3

A graph with x- and y- axis both ranging from –8 to 8. A line is drawn to demonstrate x = 3.

x=−4

Everyday Math

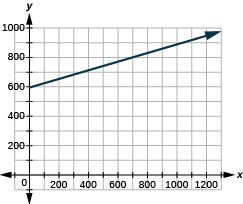
Motor home cost The Robinsons rented a motor home for one week to go on vacation. It cost them $594 plus $0.32 per mile to rent the motor home, so the linear equation y=594+0.32x gives the cost, y, for driving x miles. Calculate the rental cost for driving 400,800,and1,200 miles, and then graph the line.

The graph shows the x y-coordinate plane. The x-axis runs from 0 to 1000. The y-axis runs from 0 to 1200. A line passes through the points “ordered pair 0,  594” and “ordered pair 800, 850”.

$722, $850, $978

Weekly earning At the art gallery where he works, Salvador gets paid $200 per week plus 15% of the sales he makes, so the equation y=200+0.15x gives the amount y he earns for selling x dollars of artwork. Calculate the amount Salvador earns for selling $900, $1,600,and$2,000, and then graph the line.

Writing Exercises

Explain how you would choose three x-values to make a table to graph the line y=15x2.

Answers will vary.

What is the difference between the equations of a vertical and a horizontal line?

Self Check

ⓐ After completing the exercises, use this checklist to evaluate your mastery of the objectives of this section.

A self-assessment table for math skills, asking students to rate their ability to graph linear equations by plotting points, and graph vertical and horizontal lines.
Figure 11.16

ⓑ After reviewing this checklist, what will you do to become confident for all objectives?