
2.2 Parametric Playground
Parametric curves earn their keep in the plane long before they need a third dimension. The pair , describes a motion, and curves that are awkward or impossible to write as often have short, transparent parametric stories. This section is a playground with two classic inhabitants, each carrying a slider so you can interrogate the formula by moving it.
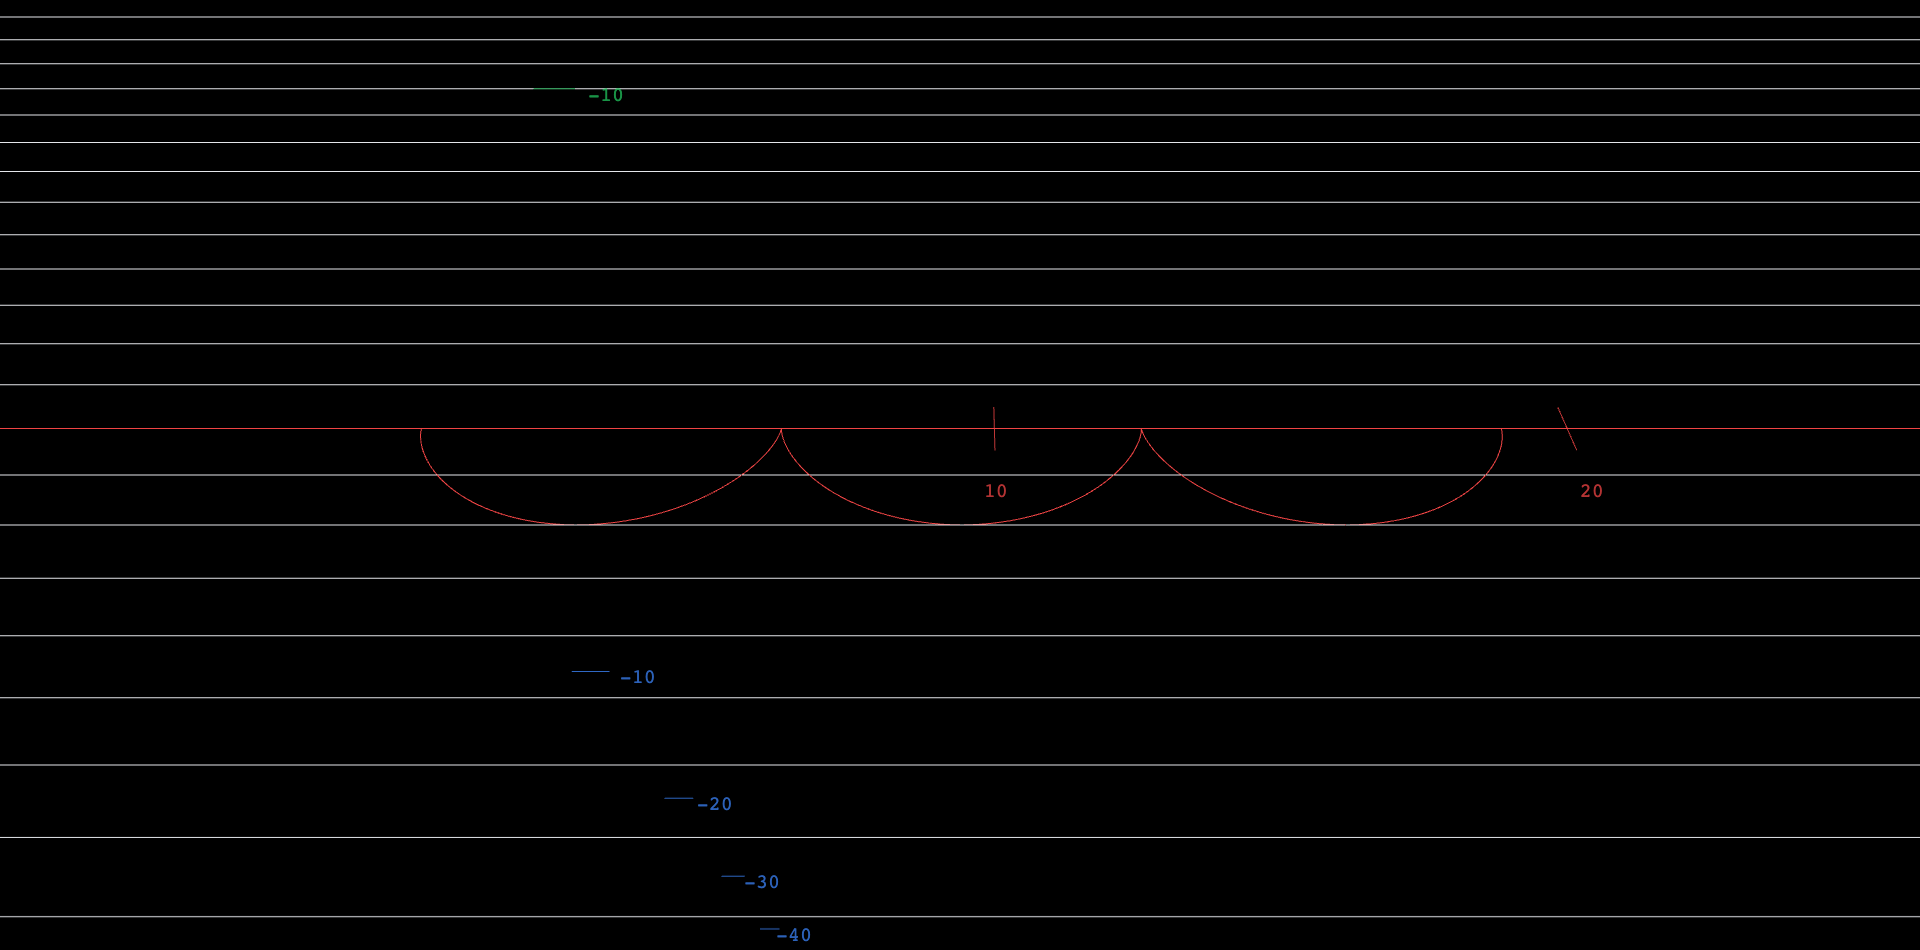
First, the cycloid: the path traced by a pebble stuck to the rim of a wheel of radius rolling along a line. Rolling means the wheel's rotation and its forward travel are locked together — after turning through angle , the axle has advanced exactly . Subtracting the pebble's position on the rim from the axle's motion gives
 Explore in 3D (opens in a new tab)
Explore the cycloid
- Each arch ends in a sharp point — a cusp — where the curve touches the baseline. Physically, the pebble is at the bottom of the wheel there. At which parameter values does that happen, and why does the motion momentarily stall?
- Drag from 0.5 to 2. Height and width scale together — read the arch height and the arch width off the grid as multiples of . (You should find height and width .)
- The curve never dips below the baseline and never doubles back in . Which parts of the two formulas guarantee each fact?
Second, the polar rose. A polar curve is secretly parametric: since and , the graph is the parametric curve
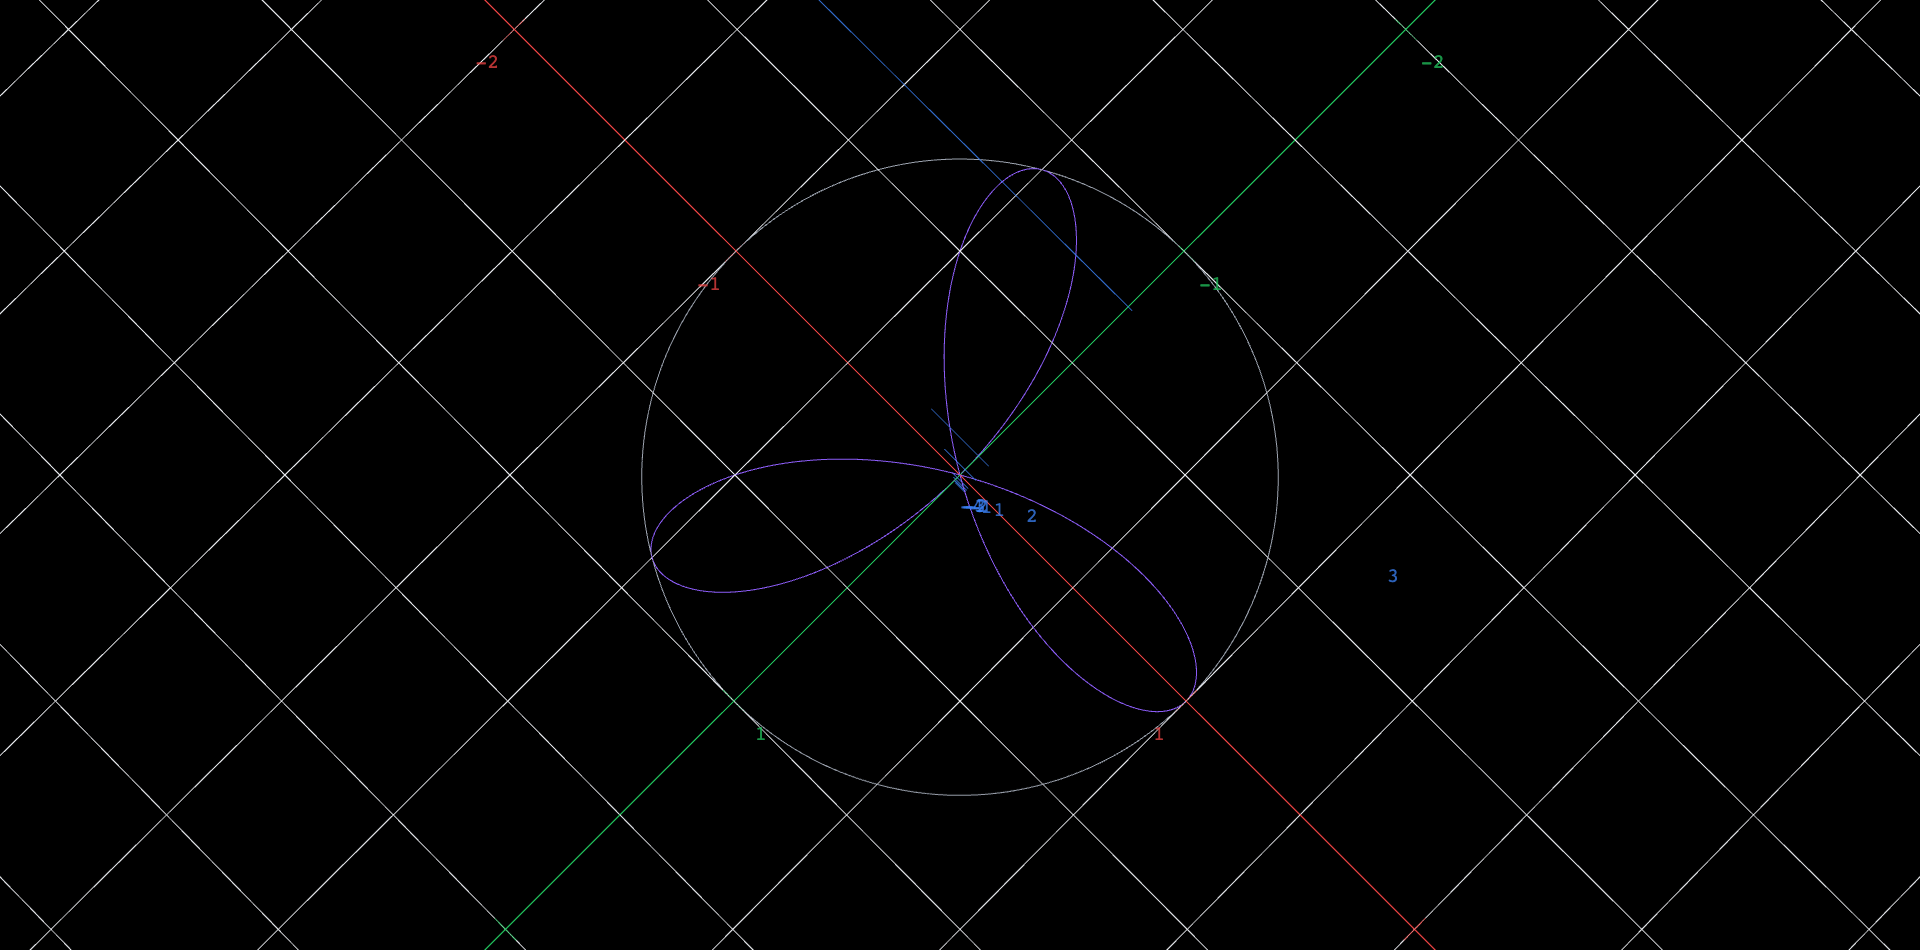
with the polar angle as parameter. Take for a whole number and you get a rose.
 Explore in 3D (opens in a new tab)
Explore the rose
- Set and identify the curve (it is a familiar shape in disguise — a circle of radius one half through the origin). Then count petals at and record the counts.
- The pattern splits by parity: odd gives petals, even gives . Watch the curve being traced near a value where is negative: a negative radius plots the point on the opposite side of the origin. For odd , where do those negative-radius petals land?
- Every petal tip touches the dashed circle. Why must the whole rose live inside it?
Why parity decides the petal count
A petal is traced each time runs from 0 up to and back to 0, which happens times as crosses . When is even, those passes land in distinct directions: petals. When is odd, the negative-radius passes retrace petals already drawn on the opposite side — each petal is drawn exactly twice — leaving only visible. The slider makes this a two-minute experiment; the algebra behind it is the single identity that and name the same point.
An original work of XYZ Homework, built around interactive XYZ 3D figures. Aligned to OpenStax Calculus Volume 3 (Strang & Herman), © OpenStax (Rice University), licensed CC BY-NC-SA 4.0; no OpenStax content is reproduced, and this work is not affiliated with or endorsed by OpenStax or Rice University. License: CC-BY-NC-SA-4.0.