
15.5 Complex Recursive Sequences
We will now explore recursively defined sequences of complex numbers.
The previous example generated a basic linear sequence of real numbers. The same process can be used with complex numbers.
Mandelbrot Set
The Mandelbrot Set is a set of numbers defined based on recursive sequences
# Is c in the Mandelbrot set?  Start at z = 0 and apply z -> z*z + c over and over.
# If the point ever gets more than 2 units from the origin it escapes and c is OUT.
C_VALUES = [1 + 1j, 0.5j, 0.4 + 0.3j, -1 + 0j, 0.3 + 0.5j, -0.75 + 0.1j]   # EDIT
MAX_STEPS = 12       # EDIT

def show(c):
    a, b = round(c.real, 5), round(c.imag, 5)
    sign = "+" if b >= 0 else "-"
    return f"{a:g} {sign} {abs(b):g}i"

for c in C_VALUES:
    print(f"c = {show(c)}")
    z = 0j
    escaped_at = None
    for k in range(1, MAX_STEPS + 1):
        z = z * z + c
        far = abs(z)
        print(f"   z{k} = z{k - 1}^2 + c = {show(z):>26}   distance from 0 = {far:.4f}"
              + ("   ESCAPED" if far > 2 and escaped_at is None else ""))
        if far > 2:
            escaped_at = k
            break
    if escaped_at:
        print(f"   -> ran away after {escaped_at} step(s): c is NOT in the Mandelbrot set\n")
    else:
        print(f"   -> still within 2 units after {MAX_STEPS} steps: c looks like it IS "
              f"in the set (not a proof)\n")

print("the whole test, in three lines of Python:")
print("   z = 0")
print("   for _ in range(50): z = z*z + c")
print("   inside = abs(z) <= 2")
# Try it: 0.25 + 0j is just inside; 0.26 + 0j escapes. Try both.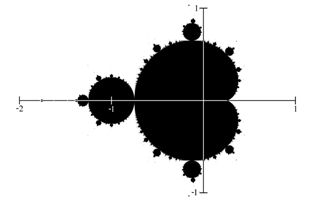 If all complex numbers are tested, and we plot each number that is in the Mandelbrot set on the complex plane, we obtain the shape to the right[1].
The boundary of this shape exhibits quasi-self-similarity, in that portions look very similar to the whole.
In addition to coloring the Mandelbrot set itself black, it is common to the color the points in the complex plane surrounding the set. To create a meaningful coloring, often people count the number of iterations of the recursive sequence that are required for a point to get further than 2 units away from the origin. For example, using above, the sequence was distance 2 from the origin after only two recursions.
import numpy as np
import matplotlib.pyplot as plt

# EDIT the window to zoom. Interesting spots to try:
#   the whole set:  -2.2, 0.8, -1.2, 1.2      MAXIT 60
#   seahorse valley: -0.80, -0.70, 0.10, 0.20  MAXIT 200
#   the tail:       -1.80, -1.72, -0.04, 0.04  MAXIT 200
XMIN, XMAX, YMIN, YMAX = -2.2, 0.8, -1.2, 1.2
MAXIT = 60
PIXELS = 420

x = np.linspace(XMIN, XMAX, PIXELS)
y = np.linspace(YMIN, YMAX, PIXELS)
C = x[None, :] + 1j * y[:, None]
Z = np.zeros_like(C)
escape = np.zeros(C.shape, dtype=int)
alive = np.ones(C.shape, dtype=bool)

for k in range(1, MAXIT + 1):
    Z[alive] = Z[alive] ** 2 + C[alive]
    gone = alive & (np.abs(Z) > 2)
    escape[gone] = k          # how many steps it took to get 2 units from the origin
    alive &= ~gone

inside = alive.sum()
print(f"window: real {XMIN} to {XMAX}, imaginary {YMIN} to {YMAX}, {MAXIT} steps allowed")
print(f"of {escape.size:,} sampled points, {inside:,} never escaped "
      f"({inside / escape.size:.1%}) - those are drawn black")
print(f"{'escaped after':>16}{'points':>12}")
for lo, hi in ((1, 2), (3, 5), (6, 10), (11, 25), (26, MAXIT)):
    if lo <= MAXIT:
        n = int(((escape >= lo) & (escape <= hi)).sum())
        print(f"{f'{lo}-{hi} steps':>16}{n:>12,}")
print("fast escapers get one shade, slow escapers another - that is the colouring")

# log scale on the escape count so the slow escapers near the edge stand out;
# points still inside get 0, the darkest end of the colour map.
shown = np.where(alive, 0.0, np.log1p(escape))
fig, ax = plt.subplots(figsize=(6.6, 5.6))
ax.imshow(shown, extent=(XMIN, XMAX, YMIN, YMAX), origin="lower", cmap="magma")
ax.set_xlabel("real axis"); ax.set_ylabel("imaginary axis")
ax.set_title("the Mandelbrot set, coloured by escape speed")
plt.show()
For some other numbers, it may take tens or hundreds of iterations for the sequence to get far from the origin. Numbers that get big fast are colored one shade, while colors that are slow to grow are colored another shade. For example, in the image below[2], light blue is used for numbers that get large quickly, while darker shades are used for numbers that grow more slowly. Greens, reds, and purples can be seen when we zoom in – those are used for numbers that grow very slowly.
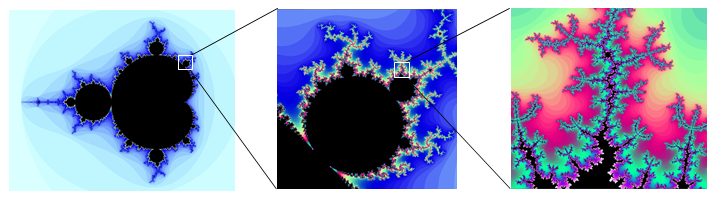
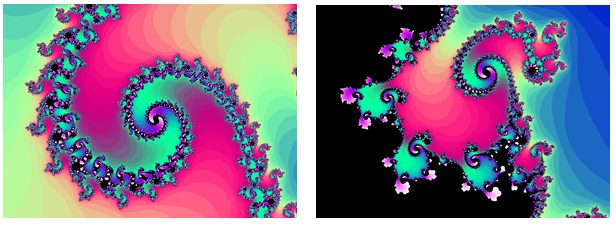
The Mandelbrot set, for having such a simple definition, exhibits immense complexity. Zooming in on other portions of the set yields fascinating swirling shapes.
[1] en.Wikipedia.org/wiki/File:Mandelset_hires.png
[2] This series was generated using Scott’s Mandelbrot Set Explorer
Adapted from Math in Society by David Lippman, hosted on LibreTexts (math.libretexts.org) and licensed under CC BY-SA 3.0. Changes were made. License: CC-BY-SA-3.0.