
4.5 Use the Slope-Intercept Form of an Equation of a Line
Recognize the Relation Between the Graph and the Slope–Intercept Form of an Equation of a Line
We have graphed linear equations by plotting points, using intercepts, recognizing horizontal and vertical lines, and using the point–slope method. Once we see how an equation in slope–intercept form and its graph are related, we’ll have one more method we can use to graph lines.
In Graph Linear Equations in Two Variables, we graphed the line of the equation by plotting points. See Figure 4.24. Let’s find the slope of this line.
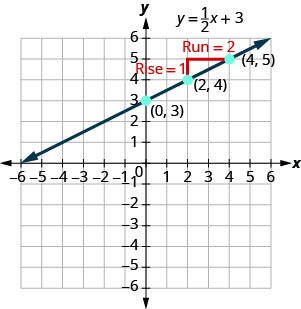
The red lines show us the rise is 1 and the run is 2. Substituting into the slope formula:
What is the y-intercept of the line? The y-intercept is where the line crosses the y-axis, so y-intercept is . The equation of this line is:

Notice, the line has:

When a linear equation is solved for , the coefficient of the term is the slope and the constant term is the y-coordinate of the y-intercept. We say that the equation is in slope–intercept form.
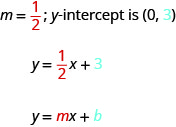
Sometimes the slope–intercept form is called the “y-form.”
Identify the Slope and y-Intercept From an Equation of a Line
In Understand Slope of a Line, we graphed a line using the slope and a point. When we are given an equation in slope–intercept form, we can use the y-intercept as the point, and then count out the slope from there. Let’s practice finding the values of the slope and y-intercept from the equation of a line.
When an equation of a line is not given in slope–intercept form, our first step will be to solve the equation for .
Graph a Line Using its Slope and Intercept
Now that we know how to find the slope and y-intercept of a line from its equation, we can graph the line by plotting the y-intercept and then using the slope to find another point.
We have used a grid with and both going from about to 10 for all the equations we’ve graphed so far. Not all linear equations can be graphed on this small grid. Often, especially in applications with real-world data, we’ll need to extend the axes to bigger positive or smaller negative numbers.
Now that we have graphed lines by using the slope and y-intercept, let’s summarize all the methods we have used to graph lines. See Figure 4.25.
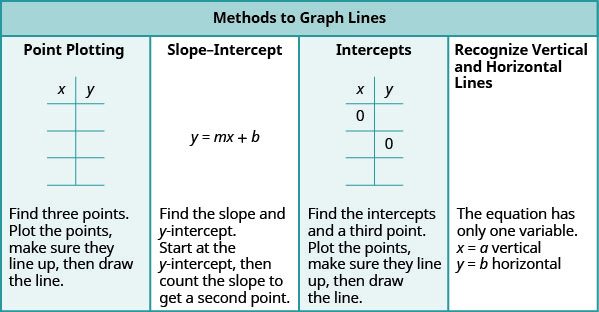
Choose the Most Convenient Method to Graph a Line
Now that we have seen several methods we can use to graph lines, how do we know which method to use for a given equation?
While we could plot points, use the slope–intercept form, or find the intercepts for any equation, if we recognize the most convenient way to graph a certain type of equation, our work will be easier. Generally, plotting points is not the most efficient way to graph a line. We saw better methods in sections 4.3, 4.4, and earlier in this section. Let’s look for some patterns to help determine the most convenient method to graph a line.
Here are six equations we graphed in this chapter, and the method we used to graph each of them.
Equations #1 and #2 each have just one variable. Remember, in equations of this form the value of that one variable is constant; it does not depend on the value of the other variable. Equations of this form have graphs that are vertical or horizontal lines.
In equations #3 and #4, both and are on the same side of the equation. These two equations are of the form . We substituted to find the x-intercept and to find the y-intercept, and then found a third point by choosing another value for or .
Equations #5 and #6 are written in slope–intercept form. After identifying the slope and y-intercept from the equation we used them to graph the line.
This leads to the following strategy.
Graph and Interpret Applications of Slope–Intercept
Many real-world applications are modeled by linear equations. We will take a look at a few applications here so you can see how equations written in slope–intercept form relate to real-world situations.
Usually when a linear equation models a real-world situation, different letters are used for the variables, instead of x and y. The variable names remind us of what quantities are being measured.
The cost of running some types business has two components—a fixed cost and a variable cost. The fixed cost is always the same regardless of how many units are produced. This is the cost of rent, insurance, equipment, advertising, and other items that must be paid regularly. The variable cost depends on the number of units produced. It is for the material and labor needed to produce each item.
Use Slopes to Identify Parallel Lines
The slope of a line indicates how steep the line is and whether it rises or falls as we read it from left to right. Two lines that have the same slope are called parallel lines. Parallel lines never intersect.

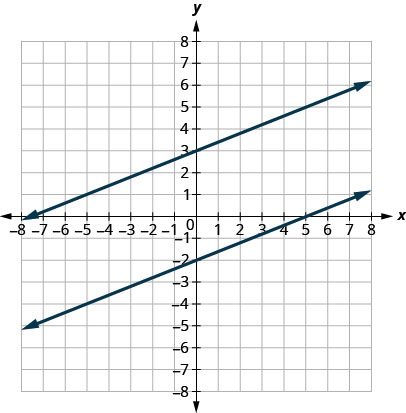
We say this more formally in terms of the rectangular coordinate system. Two lines that have the same slope and different y-intercepts are called parallel lines. See Figure 4.27.
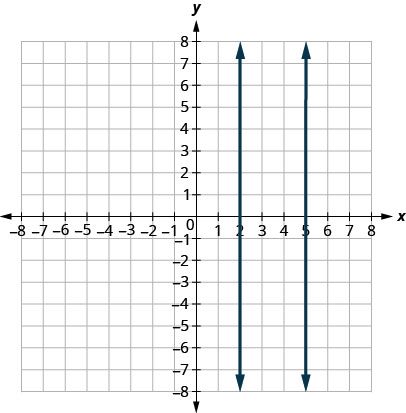
What about vertical lines? The slope of a vertical line is undefined, so vertical lines don’t fit in the definition above. We say that vertical lines that have different x-intercepts are parallel. See Figure 4.28.
Let’s graph the equations and on the same grid. The first equation is already in slope–intercept form: . We solve the second equation for :
Graph the lines.
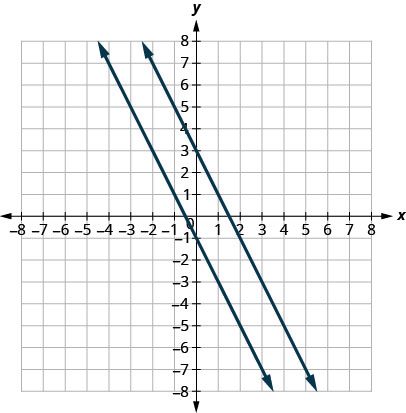
Notice the lines look parallel. What is the slope of each line? What is the y-intercept of each line?
The slopes of the lines are the same and the y-intercept of each line is different. So we know these lines are parallel.
Since parallel lines have the same slope and different y-intercepts, we can now just look at the slope–intercept form of the equations of lines and decide if the lines are parallel.
Use Slopes to Identify Perpendicular Lines
Let’s look at the lines whose equations are and , shown in Figure 4.29.
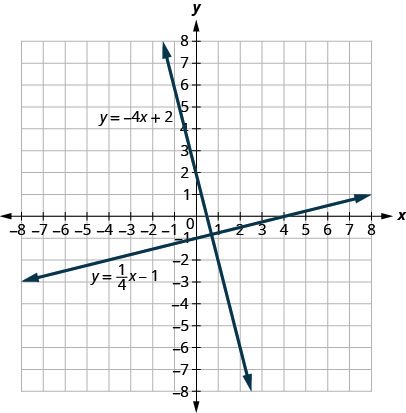
These lines lie in the same plane and intersect in right angles. We call these lines perpendicular.
What do you notice about the slopes of these two lines? As we read from left to right, the line rises, so its slope is positive. The line drops from left to right, so it has a negative slope. Does it make sense to you that the slopes of two perpendicular lines will have opposite signs?
If we look at the slope of the first line, , and the slope of the second line, , we can see that they are negative reciprocals of each other. If we multiply them, their product is
This is always true for perpendicular lines and leads us to this definition.
We were able to look at the slope–intercept form of linear equations and determine whether or not the lines were parallel. We can do the same thing for perpendicular lines.
We find the slope–intercept form of the equation, and then see if the slopes are negative reciprocals. If the product of the slopes is , the lines are perpendicular. Perpendicular lines may have the same y-intercepts.
Key Concepts
- The slope–intercept form of an equation of a line with slope and y-intercept, is, .
- Graph a Line Using its Slope and y-Intercept
- Find the slope-intercept form of the equation of the line.
- Identify the slope and y-intercept.
- Plot the y-intercept.
- Use the slope formula to identify the rise and the run.
- Starting at the y-intercept, count out the rise and run to mark the second point.
- Connect the points with a line.
- Strategy for Choosing the Most Convenient Method to Graph a Line: Consider the form of the equation.
- If it only has one variable, it is a vertical or horizontal line.
is a vertical line passing through the x-axis at .
is a horizontal line passing through the y-axis at . - If is isolated on one side of the equation, in the form , graph by using the slope and y-intercept.
Identify the slope and y-intercept and then graph. - If the equation is of the form , find the intercepts.
Find the x- and y-intercepts, a third point, and then graph.
- If it only has one variable, it is a vertical or horizontal line.
- Parallel lines are lines in the same plane that do not intersect.
- Parallel lines have the same slope and different y-intercepts.
- If m1 and m2 are the slopes of two parallel lines then
- Parallel vertical lines have different x-intercepts.
- Perpendicular lines are lines in the same plane that form a right angle.
- If are the slopes of two perpendicular lines, then and .
- Vertical lines and horizontal lines are always perpendicular to each other.
Practice Makes Perfect
Recognize the Relation Between the Graph and the Slope–Intercept Form of an Equation of a Line
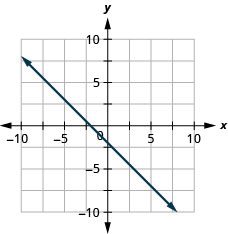
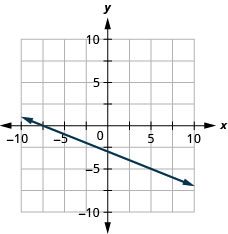
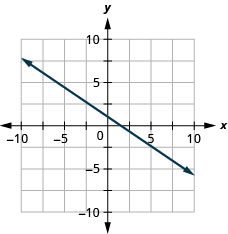
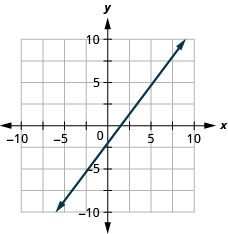
In the following exercises, use the graph to find the slope and y-intercept of each line. Compare the values to the equation .
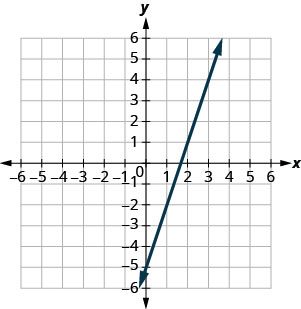
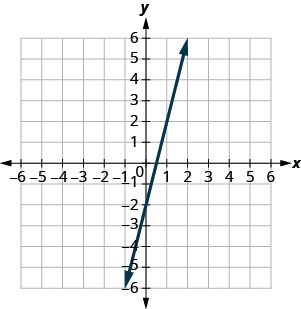
slope and y-intercept
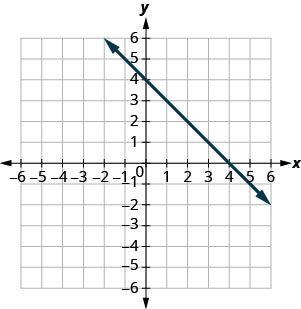
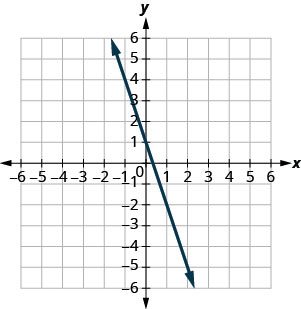
slope and y-intercept
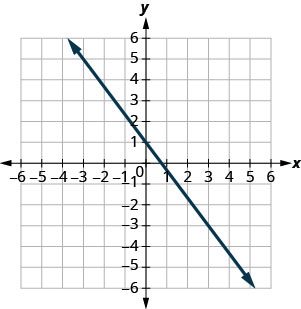
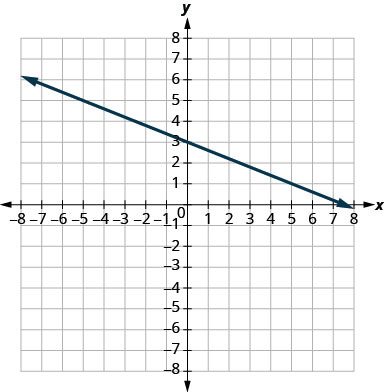
slope and y-intercept
Identify the Slope and y-Intercept From an Equation of a Line
In the following exercises, identify the slope and y-intercept of each line.
Graph a Line Using Its Slope and Intercept
In the following exercises, graph the line of each equation using its slope and y-intercept.
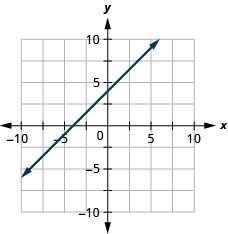
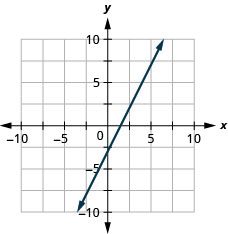
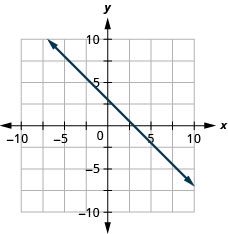
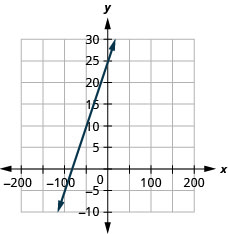
Choose the Most Convenient Method to Graph a Line
In the following exercises, determine the most convenient method to graph each line.
horizontal line
vertical line
slope–intercept
intercepts
slope–intercept
horizontal line
intercepts
slope–intercept
Graph and Interpret Applications of Slope–Intercept
The equation models the relation between the amount of Tuyet’s monthly water bill payment, P, in dollars, and the number of units of water, w, used.
- ⓐ Find Tuyet’s payment for a month when 0 units of water are used.
- ⓑ Find Tuyet’s payment for a month when 12 units of water are used.
- ⓒ Interpret the slope and P-intercept of the equation.
- ⓓ Graph the equation.
The equation models the relation between the amount of Randy’s monthly water bill payment, P, in dollars, and the number of units of water, w, used.
- ⓐ Find the payment for a month when Randy used 0 units of water.
- ⓑ Find the payment for a month when Randy used 15 units of water.
- ⓒ Interpret the slope and P-intercept of the equation.
- ⓓ Graph the equation.
- ⓐ $28
- ⓑ $66.10
- ⓒ The slope, 2.54, means that Randy’s payment, P, increases by $2.54 when the number of units of water he used, w, increases by 1. The P–intercept means that if the number units of water Randy used was 0, the payment would be $28.
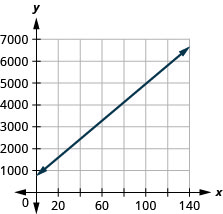
- ⓓ
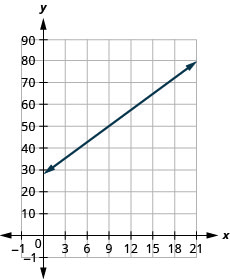
Bruce drives his car for his job. The equation models the relation between the amount in dollars, R, that he is reimbursed and the number of miles, m, he drives in one day.
- ⓐ Find the amount Bruce is reimbursed on a day when he drives 0 miles.
- ⓑ Find the amount Bruce is reimbursed on a day when he drives 220 miles.
- ⓒ Interpret the slope and R-intercept of the equation.
- ⓓ Graph the equation.
Janelle is planning to rent a car while on vacation. The equation models the relation between the cost in dollars, C, per day and the number of miles, m, she drives in one day.
- ⓐ Find the cost if Janelle drives the car 0 miles one day.
- ⓑ Find the cost on a day when Janelle drives the car 400 miles.
- ⓒ Interpret the slope and C–intercept of the equation.
- ⓓ Graph the equation.
- ⓐ $15
- ⓑ $143
- ⓒ The slope, 0.32, means that the cost, C, increases by $0.32 when the number of miles driven, m, increases by 1. The C-intercept means that if Janelle drives 0 miles one day, the cost would be $15.
- ⓓ
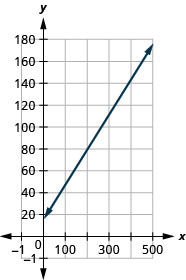
Cherie works in retail and her weekly salary includes commission for the amount she sells. The equation models the relation between her weekly salary, S, in dollars and the amount of her sales, c, in dollars.
- ⓐ Find Cherie’s salary for a week when her sales were 0.
- ⓑ Find Cherie’s salary for a week when her sales were 3600.
- ⓒ Interpret the slope and S–intercept of the equation.
- ⓓ Graph the equation.
Patel’s weekly salary includes a base pay plus commission on his sales. The equation models the relation between his weekly salary, S, in dollars and the amount of his sales, c, in dollars.
- ⓐ Find Patel’s salary for a week when his sales were 0.
- ⓑ Find Patel’s salary for a week when his sales were 18,540.
- ⓒ Interpret the slope and S-intercept of the equation.
- ⓓ Graph the equation.
- ⓐ $750
- ⓑ $2418.60
- ⓒ The slope, 0.09, means that Patel’s salary, S, increases by $0.09 for every $1 increase in his sales. The S-intercept means that when his sales are $0, his salary is $750.
- ⓓ
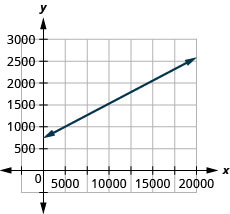
Costa is planning a lunch banquet. The equation models the relation between the cost in dollars, C, of the banquet and the number of guests, g.
- ⓐ Find the cost if the number of guests is 40.
- ⓑ Find the cost if the number of guests is 80.
- ⓒ Interpret the slope and C-intercept of the equation.
- ⓓ Graph the equation.
Margie is planning a dinner banquet. The equation models the relation between the cost in dollars, C of the banquet and the number of guests, g.
- ⓐ Find the cost if the number of guests is 50.
- ⓑ Find the cost if the number of guests is 100.
- ⓒ Interpret the slope and C–intercept of the equation.
- ⓓ Graph the equation.
- ⓐ $2850
- ⓑ $4950
- ⓒ The slope, 42, means that the cost, C, increases by $42 for when the number of guests increases by 1. The C-intercept means that when the number of guests is 0, the cost would be $750.
- ⓓ
Use Slopes to Identify Parallel Lines
In the following exercises, use slopes and y-intercepts to determine if the lines are parallel.
parallel
parallel
not parallel
parallel
parallel
parallel
parallel
parallel
not parallel
not parallel
not parallel
not parallel
not parallel
Use Slopes to Identify Perpendicular Lines
In the following exercises, use slopes and y-intercepts to determine if the lines are perpendicular.
perpendicular
perpendicular
not perpendicular
not perpendicular
perpendicular
perpendicular
Everyday Math
The equation can be used to convert temperatures F, on the Fahrenheit scale to temperatures, C, on the Celsius scale.
- ⓐ Explain what the slope of the equation means.
- ⓑ Explain what the C–intercept of the equation means.
The equation is used to estimate the number of cricket chirps, n, in one minute based on the temperature in degrees Fahrenheit, T.
- ⓐ Explain what the slope of the equation means.
- ⓑ Explain what the n–intercept of the equation means. Is this a realistic situation?
- ⓐ For every increase of one degree Fahrenheit, the number of chirps increases by four.
- ⓑ There would be chirps when the Fahrenheit temperature is . (Notice that this does not make sense; this model cannot be used for all possible temperatures.)
Writing Exercises
Explain in your own words how to decide which method to use to graph a line.
Why are all horizontal lines parallel?
Answers will vary.
Self Check
ⓐ After completing the exercises, use this checklist to evaluate your mastery of the objectives of this section.
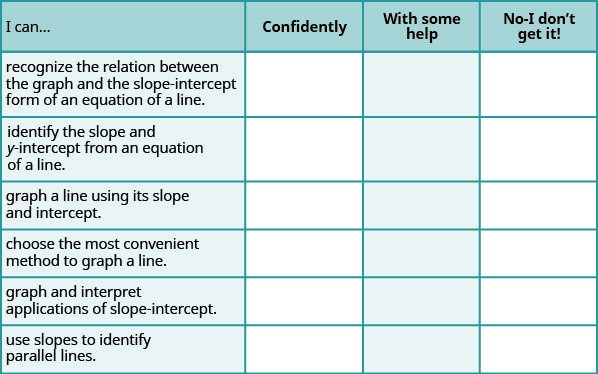
ⓑ After looking at the checklist, do you think you are well-prepared for the next section? Why or why not?