Login
📚 Elementary Algebra 2e
Chapters ▾
⇩ Download ▾

4.3 Graph with Intercepts

Identify the x- and y- Intercepts on a Graph

Every linear equation can be represented by a unique line that shows all the solutions of the equation. We have seen that when graphing a line by plotting points, you can use any three solutions to graph. This means that two people graphing the line might use different sets of three points.

At first glance, their two lines might not appear to be the same, since they would have different points labeled. But if all the work was done correctly, the lines should be exactly the same. One way to recognize that they are indeed the same line is to look at where the line crosses the x- axis and the y- axis. These points are called the intercepts of the line.

Let’s look at the graphs of the lines in Figure 4.18.
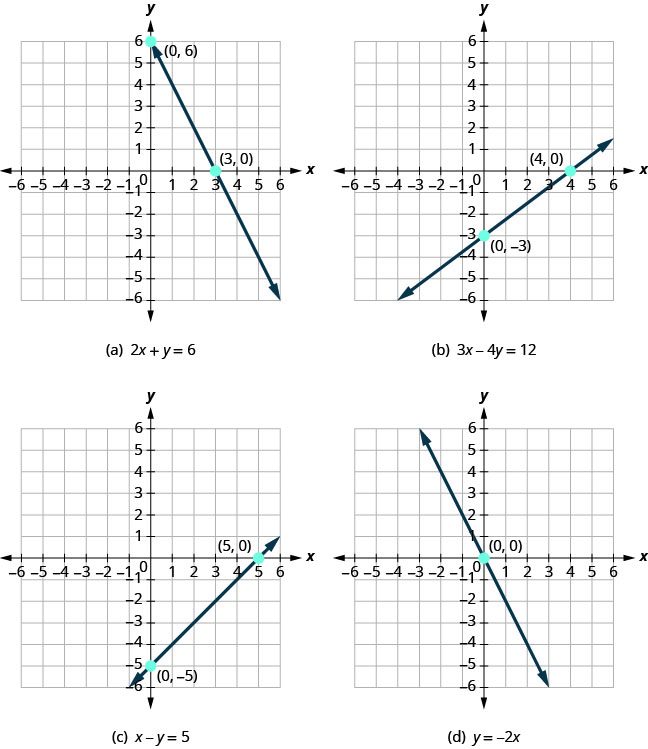
Four figures, each showing a different straight line on the x y- coordinate plane. The x- axis of the planes runs from negative 7 to 7. The y- axis of the planes runs from negative 7 to 7. Figure a shows a straight line crossing the x- axis at the point (3, 0) and crossing the y- axis at the point (0, 6). The graph is labeled with the equation 2x plus y equals 6. Figure b shows a straight line crossing the x- axis at the point (4, 0) and crossing the y- axis at the point (0, negative 3). The graph is labeled with the equation 3x minus 4y equals 12. Figure c shows a straight line crossing the x- axis at the point (5, 0) and crossing the y- axis at the point (0, negative 5). The graph is labeled with the equation x minus y equals 5. Figure d shows a straight line crossing the x- axis and y- axis at the point (0, 0). The graph is labeled with the equation y equals negative 2x.
Figure 4.18 Examples of graphs crossing the x-axis.

First, notice where each of these lines crosses the x-axis. See Figure 4.18.

Table 4.25
FigureThe line crosses the x- axis at:Ordered pair of this point
Figure (a)3(3,0)
Figure (b)4(4,0)
Figure (c)5(5,0)
Figure (d)0(0,0)

Do you see a pattern?

For each row, the y- coordinate of the point where the line crosses the x- axis is zero. The point where the line crosses the x- axis has the form (a,0) and is called the x- intercept of a line. The x- intercept occurs when y is zero.

Now, let’s look at the points where these lines cross the y- axis. See Table 4.26.

Table 4.26
FigureThe line crosses the y-axis at:Ordered pair for this point
Figure (a)6(0,6)
Figure (b)−3(0,−3)
Figure (c)−5(0,−5)
Figure (d)0(0,0)

What is the pattern here?

In each row, the x- coordinate of the point where the line crosses the y- axis is zero. The point where the line crosses the y- axis has the form (0,b) and is called the y- intercept of the line. The y- intercept occurs when x is zero.

Find the x- and y- Intercepts from an Equation of a Line

Recognizing that the x- intercept occurs when y is zero and that the y- intercept occurs when x is zero, gives us a method to find the intercepts of a line from its equation. To find the x- intercept, let y=0 and solve for x. To find the y- intercept, let x=0 and solve for y.

Graph a Line Using the Intercepts

To graph a linear equation by plotting points, you need to find three points whose coordinates are solutions to the equation. You can use the x- and y- intercepts as two of your three points. Find the intercepts, and then find a third point to ensure accuracy. Make sure the points line up—then draw the line. This method is often the quickest way to graph a line.
The steps to graph a linear equation using the intercepts are summarized below.

Key Concepts

  • Find the x- and y- Intercepts from the Equation of a Line
    • Use the equation of the line to find the x- intercept of the line, let y=0 and solve for x.
    • Use the equation of the line to find the y- intercept of the line, let x=0 and solve for y.
  • Graph a Linear Equation using the Intercepts
    1. Find the x- and y- intercepts of the line.
      Let y=0 and solve for x.
      Let x=0 and solve for y.
    2. Find a third solution to the equation.
    3. Plot the three points and then check that they line up.
    4. Draw the line.
  • Strategy for Choosing the Most Convenient Method to Graph a Line:
    • Consider the form of the equation.
    • If it only has one variable, it is a vertical or horizontal line.
      x=a is a vertical line passing through the x- axis at a
      y=b is a horizontal line passing through the y- axis at b.
    • If y is isolated on one side of the equation, graph by plotting points.
    • Choose any three values for x and then solve for the corresponding y- values.
    • If the equation is of the form ax+by=c, find the intercepts. Find the x- and y- intercepts and then a third point.

Practice Makes Perfect

Identify the x- and y- Intercepts on a Graph

In the following exercises, find the x- and y- intercepts on each graph.
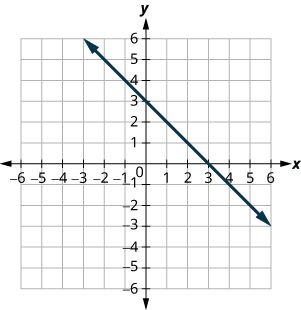
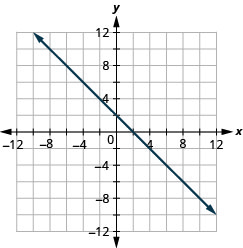
The figure shows a straight line on the x y- coordinate plane. The x- axis of the plane runs from negative 10 to 10. The y- axis of the planes runs from negative 10 to 10. The straight line goes through the points (negative 5, 8), (negative 4, 7), (negative 3, 6), (negative 2, 5), (negative 1, 4), (0, 3), (1, 2), (2, 1), (3, 0), (4, negative 1), (5, negative 2) and (6, negative 3).

(3,0),(0,3)

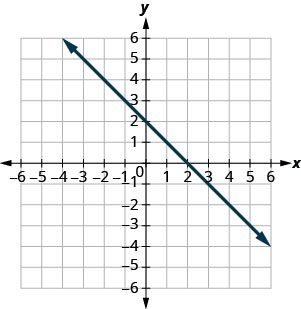
The figure shows a straight line on the x y- coordinate plane. The x- axis of the plane runs from negative 10 to 10. The y- axis of the planes runs from negative 10 to 10. The straight line goes through the points (negative 6, 8), (negative 5, 7), (negative 4, 6), (negative 3, 5), (negative 2, 4), (negative 1, 3), (0, 2), (1, 1), (2, 0), (3, negative 1), (4, negative 2), (5, negative 3) and (6, negative 4).
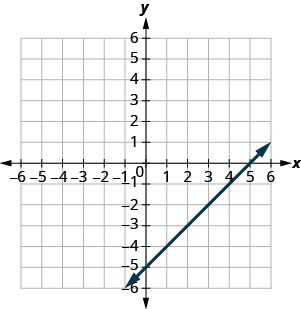
The figure shows a straight line on the x y- coordinate plane. The x- axis of the plane runs from negative 10 to 10. The y- axis of the planes runs from negative 10 to 10. The straight line goes through the points (negative 5, negative 10), (negative 4, negative 9), (negative 3, negative 8), (negative 2, negative 7), (negative 1, negative 6), (0, negative 5), (1, negative 4), (2, negative 3), (3, negative 2), (4, negative 1), (5, 0), (6, 1), (7, 2), and (8, 3).

(5,0),(0,−5)

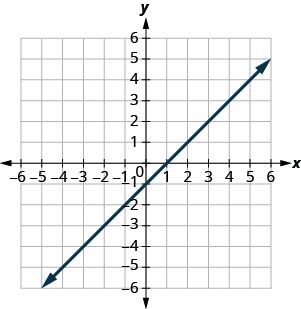
The figure shows a straight line on the x y- coordinate plane. The x- axis of the plane runs from negative 10 to 10. The y- axis of the planes runs from negative 10 to 10. The straight line goes through the points (negative 6, negative 7), (negative 5, negative 6), (negative 4, negative 5), (negative 3, negative 4), (negative 2, negative 3), (negative 1, negative 2), (0, negative 1), (1, 0), (2, 1), (3, 2), (4, 3), (5, 4), (6, 5), (7, 6), and (8, 7).

(−2,0),(0,−2)

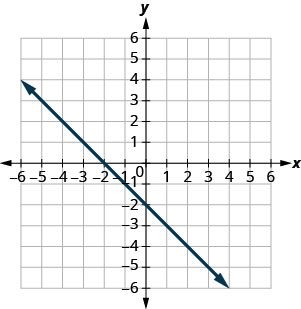
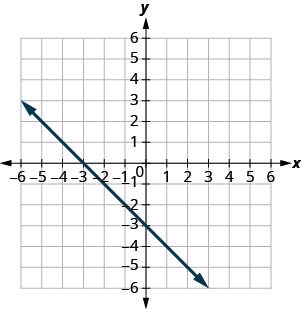
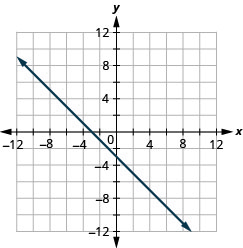
The figure shows a straight line on the x y- coordinate plane. The x- axis of the plane runs from negative 10 to 10. The y- axis of the planes runs from negative 10 to 10. The straight line goes through the points (negative 6, 3), (negative 5, 2), (negative 4, 1), (negative 3, 0), (negative 2, negative 1), (negative 1, negative 2), (0, negative 3), (1, negative 4), (2, negative 5), (3, negative 6), (4, negative 7), (5, negative 8), and (6, negative 9).
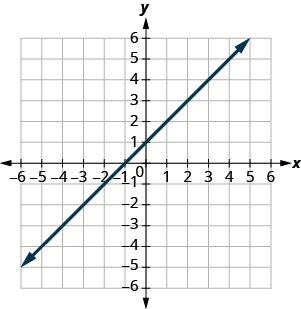
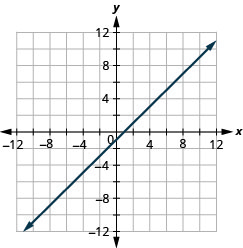
The figure shows a straight line on the x y- coordinate plane. The x- axis of the plane runs from negative 10 to 10. The y- axis of the planes runs from negative 10 to 10. The straight line goes through the points (negative 6, negative 5), (negative 5, negative 4), (negative 4, negative 3), (negative 3, negative 2), (negative 2, negative 1), (negative 1, 0), (0, 1), (1, 2), (2, 3), (3, 4), (4, 5), (5, 6), (6, 7), (7, 8), and (8, 9).

(−1,0),(0,1)

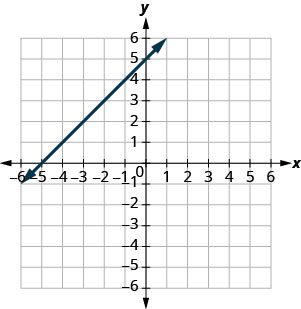
The figure shows a straight line on the x y- coordinate plane. The x- axis of the plane runs from negative 10 to 10. The y- axis of the planes runs from negative 10 to 10. The straight line goes through the points (negative 8, negative 3), (negative 7, negative 2), (negative 6, negative 1), (negative 5, 0), (negative 4, 1), (negative 3, 2), (negative 2, 3), (negative 1, 4), (0, 5), (1, 6), (2, 7), (3, 8), (4, 9), and (5, 10).
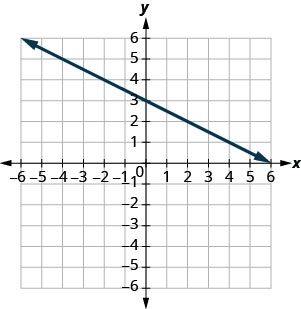
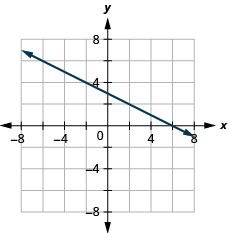
The figure shows a straight line on the x y- coordinate plane. The x- axis of the plane runs from negative 10 to 10. The y- axis of the planes runs from negative 10 to 10. The straight line goes through the points (negative 10, 8), (negative 8, 7), (negative 6, 6), (negative 4, 5), (negative 2, 4), (0, 3), (2, 2), (4, 1), (6, 0), (8, negative 1), and (10, negative 2).

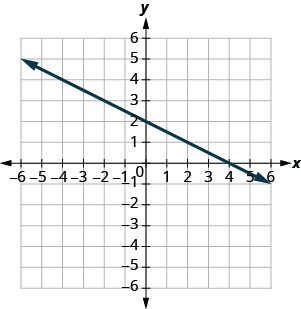
(6,0),(0,3)

The figure shows a straight line on the x y- coordinate plane. The x- axis of the plane runs from negative 7 to 7. The y- axis of the planes runs from negative 7 to 7. The straight line goes through the points (negative 6, 5), (negative 4, 4), (negative 2, 3), (0, 2), (2, 1), (4, 0), and (6, negative 1).
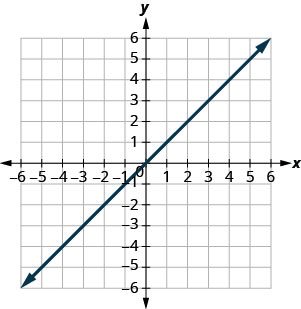
The figure shows a straight line on the x y- coordinate plane. The x- axis of the plane runs from negative 10 to 10. The y- axis of the planes runs from negative 10 to 10. The straight line goes through the plotted point (0, 0).

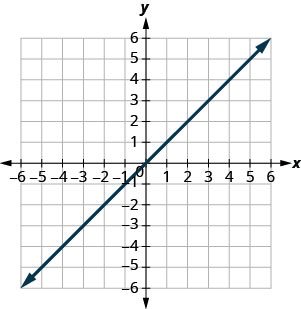
(0,0)

The figure shows a straight line on the x y- coordinate plane. The x- axis of the plane runs from negative 7 to 7. The y- axis of the planes runs from negative 7 to 7. The straight line goes through the plotted point (0, 0).

Find the x- and y- Intercepts from an Equation of a Line

In the following exercises, find the intercepts for each equation.

x+y=4

(4,0),(0,4)

x+y=3

x+y=−2

(−2,0),(0,−2)

x+y=−5

xy=5

(5,0),(0,−5)

xy=1

xy=−3

(−3,0),(0,3)

xy=−4

x+2y=8

(8,0),(0,4)

x+2y=10

3x+y=6

(2,0),(0,6)

3x+y=9

x3y=12

(12,0),(0,−4)

x2y=8

4xy=8

(2,0),(0,−8)

5xy=5

2x+5y=10

(5,0),(0,2)

2x+3y=6

3x2y=12

(4,0),(0,−6)

3x5y=30

y=13x+1

(−3,0),(0,1)

y=14x1

y=15x+2

(−10,0),(0,2)

y=13x+4

y=3x

(0,0)

y=−2x

y=−4x

(0,0)

y=5x

Graph a Line Using the Intercepts

In the following exercises, graph using the intercepts.
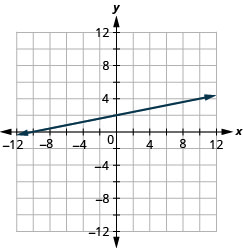
x+5y=10

The figure shows a straight line on the x y- coordinate plane. The x- axis of the plane runs from negative 12 to 12. The y- axis of the planes runs from negative 12 to 12. The line graphed is negative x plus 5 y equals 10.

x+4y=8

x+2y=4

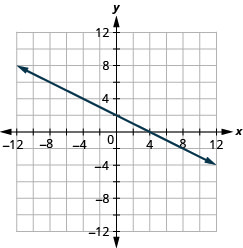
The figure shows a straight line on the x y- coordinate plane. The x- axis of the plane runs from negative 12 to 12. The y- axis of the planes runs from negative 12 to 12. The straight line goes through the points (negative 8, 6), (negative 6, 5), (negative 4, 4), (negative 2, 3), (0, 2), (2, 1), (4, 0), (6, negative 1), (8, negative 2), and (10, negative 3).

x+2y=6

x+y=2

The figure shows a straight line on the x y- coordinate plane. The x- axis of the plane runs from negative 12 to 12. The y- axis of the planes runs from negative 12 to 12. The straight line goes through the points (negative 8, 10), (negative 7, 9), (negative 6, 8),(negative 5, 7), (negative 4, 6), (negative 3, 5), (negative 2, 4), (negative 1, 3), (0, 2), (1, 1), (2, 0), (3, negative 1), (4, negative 2), (5, negative 3), (6, negative 4), (7, negative 5), (8, negative 6), (9, negative 7), and (10, negative 8).

x+y=5

x+y=−3

The figure shows a straight line on the x y- coordinate plane. The x- axis of the plane runs from negative 7 to 7. The y- axis of the planes runs from negative 7 to 7. The straight line goes through the points (negative 7, 4), (negative 6, 3), (negative 5, 2),(negative 4, 1), (negative 3, 0), (negative 2, negative 1), (negative 1, negative 2), (0, negative 3), (1, negative 4), (2, negative 5), (3, negative 6), and (4, negative 7).

x+y=−1

xy=1

The figure shows a straight line on the x y- coordinate plane. The x- axis of the plane runs from negative 12 to 12. The y- axis of the planes runs from negative 12 to 12. The straight line goes through the points (negative 8, negative 9), (negative 7, negative 8), (negative 6, negative 7),(negative 5, negative 6), (negative 4, negative 5), (negative 3, negative 4), (negative 2, negative 3), (negative 1, negative 2), (0, negative 1), (1, 0), (2, 1), (3, 2), (4, 3), (5, 4), (6, 5), (7, 6), (8, 7), (9, 8), and (10, 9).

xy=2

xy=−4

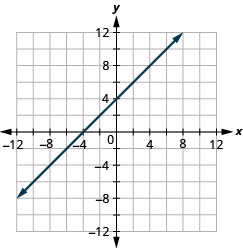
The figure shows a straight line on the x y- coordinate plane. The x- axis of the plane runs from negative 12 to 12. The y- axis of the planes runs from negative 12 to 12. The straight line goes through the points (negative 8, negative 4), (negative 7, negative 3), (negative 6, negative 2),(negative 5, negative 1), (negative 4, 0), (negative 3, 1), (negative 2, 2), (negative 1, 3), (0, 4), (1, 5), (2, 6), (3, 7), (4, 8), (5, 9), (6, 10), (7, 11), and (8, 12).

xy=−3

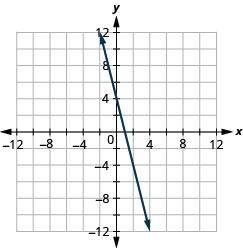
4x+y=4

The figure shows a straight line on the x y- coordinate plane. The x- axis of the plane runs from negative 12 to 12. The y- axis of the planes runs from negative 12 to 12. The straight line goes through the points (negative 2, 12), (negative 1, 8), (0, 4), (1, 0), (2, negative 4), (3, negative 8), and (4, negative 12).

3x+y=3

2x+4y=12

The figure shows a straight line on the x y- coordinate plane. The x- axis of the plane runs from negative 7 to 7. The y- axis of the planes runs from negative 7 to 7. The straight line goes through the points (negative 6, 6), (negative 4, 5), (negative 2, 4), (0, 3), (2, 2), (4, 1), and (6, 0).

3x+2y=12

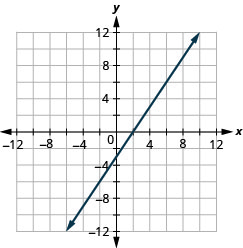
3x2y=6

The figure shows a straight line on the x y- coordinate plane. The x- axis of the plane runs from negative 12 to 12. The y- axis of the planes runs from negative 12 to 12. The straight line goes through the points (negative 6, negative 12), (negative 4, negative 9), (negative 2, negative 6), (0, negative 3), (2, 0), (4, 3), (6, 6), (8, 9), and (10, 12).

5x2y=10

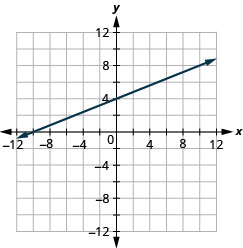
2x5y=−20

The figure shows a straight line on the x y- coordinate plane. The x- axis of the plane runs from negative 12 to 12. The y- axis of the planes runs from negative 12 to 12. The straight line goes through the points (negative 10, 0), (negative 5, 2), (0, 4), (5, 6), and (10, 8).

3x4y=−12

3xy=−6

The figure shows a straight line on the x y- coordinate plane. The x- axis of the plane runs from negative 12 to 12. The y- axis of the planes runs from negative 12 to 12. The straight line goes through the points (negative 6, negative 12), (negative 5, negative 9), (negative 4, negative 6), (negative 3, negative 3), (negative 2, 0), (1, 3), (2, 6), (3, 9), and (4, 12).

2xy=−8

y=−2x

The figure shows a straight line on the x y- coordinate plane. The x- axis of the plane runs from negative 12 to 12. The y- axis of the planes runs from negative 12 to 12. The straight line goes through the points (negative 5, 10), (negative 4, 8), (negative 3, 6), (negative 2, 4), (negative 1, 2), (0, 0), (1, negative 2), (2, negative 4), (3, negative 6), (4, negative 8), (5, negative 10), and (6, negative 12)

y=−4x

y=x

The figure shows a straight line on the x y- coordinate plane. The x- axis of the plane runs from negative 12 to 12. The y- axis of the planes runs from negative 12 to 12. The straight line goes through the points (negative 10, 10), (negative 9, 9), (negative 8, 8), (negative 7, 7), (negative 6, 6), (negative 5, 5), (negative 4, 4), (negative 3, 3), (negative 2, 2), (negative 1, 1), (0, 0), (1, 1), (2, 2), (3, 3), (4, 4), (5, 5), (6, 6), (7, 7), (8, 8), (9, 9), and (10, 10)

y=3x

Everyday Math

Road trip. Damien is driving from Chicago to Denver, a distance of 1000 miles. The x- axis on the graph below shows the time in hours since Damien left Chicago. The y- axis represents the distance he has left to drive.
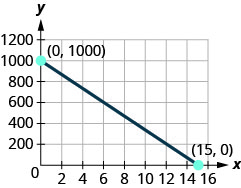
The figure shows a straight line on the x y- coordinate plane. The x- axis of the plane runs from 0 to 16. The y- axis of the planes runs from 0 to 1200 in increments of 200. The straight line goes through the points (0, 1000), (3, 800), (6, 600), (9, 400), (12, 200), and (15, 0). The points (0, 1000) and (15, 0) are marked and labeled with their coordinates.
  1. ⓐ Find the x- and y- intercepts.
  2. ⓑ Explain what the x- and y- intercepts mean for Damien.

(0,1000),(15,0)
ⓑ At (0,1000), he has been gone 0 hours and has 1000 miles left. At (15,0), he has been gone 15 hours and has 0 miles left to go.

Road trip. Ozzie filled up the gas tank of his truck and headed out on a road trip. The x- axis on the graph below shows the number of miles Ozzie drove since filling up. The y- axis represents the number of gallons of gas in the truck’s gas tank.
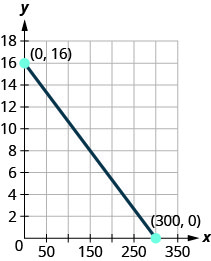
The figure shows a straight line on the x y- coordinate plane. The x- axis of the plane runs from 0 to 350 in increments of 50. The y- axis of the planes runs from 0 to 18 in increments of 2. The straight line goes through the points (0, 16), (150, 8), and (300, 0). The points (0, 16) and (300, 0) are marked and labeled with their coordinates
  1. ⓐ Find the x- and y- intercepts.
  2. ⓑ Explain what the x- and y- intercepts mean for Ozzie.

Writing Exercises

How do you find the x- intercept of the graph of 3x2y=6?

Answers will vary.

Do you prefer to use the method of plotting points or the method using the intercepts to graph the equation 4x+y=−4? Why?

Do you prefer to use the method of plotting points or the method using the intercepts to graph the equation y=23x2? Why?

Answers will vary.

Do you prefer to use the method of plotting points or the method using the intercepts to graph the equation y=6? Why?

Self Check

ⓐ After completing the exercises, use this checklist to evaluate your mastery of the objectives of this section.
The figure shows a table with four rows and four columns. The first row is a header row and it labels each column. The first column header is “I can…”, the second is "confidently", the third is “with some help”, “no minus I don’t get it!”. Under the first column are the phrases “identify the x and y intercepts of a graph”, “find the x and y intercepts from an equation of a line”, and “graph a line using intercepts”. Under the second, third, fourth columns are blank spaces where the learner can check what level of mastery they have achieved.

ⓑ What does this checklist tell you about your mastery of this section? What steps will you take to improve?