
4.4 Understand Slope of a Line
When you graph linear equations, you may notice that some lines tilt up as they go from left to right and some lines tilt down. Some lines are very steep and some lines are flatter. What determines whether a line tilts up or down or if it is steep or flat?
In mathematics, the ‘tilt’ of a line is called the slope of the line. The concept of slope has many applications in the real world. The pitch of a roof, grade of a highway, and a ramp for a wheelchair are some examples where you literally see slopes. And when you ride a bicycle, you feel the slope as you pump uphill or coast downhill.
In this section, we will explore the concept of slope.
Use Geoboards to Model Slope
A geoboard is a board with a grid of pegs on it. Using rubber bands on a geoboard gives us a concrete way to model lines on a coordinate grid. By stretching a rubber band between two pegs on a geoboard, we can discover how to find the slope of a line.
We’ll start by stretching a rubber band between two pegs as shown in Figure 4.19.
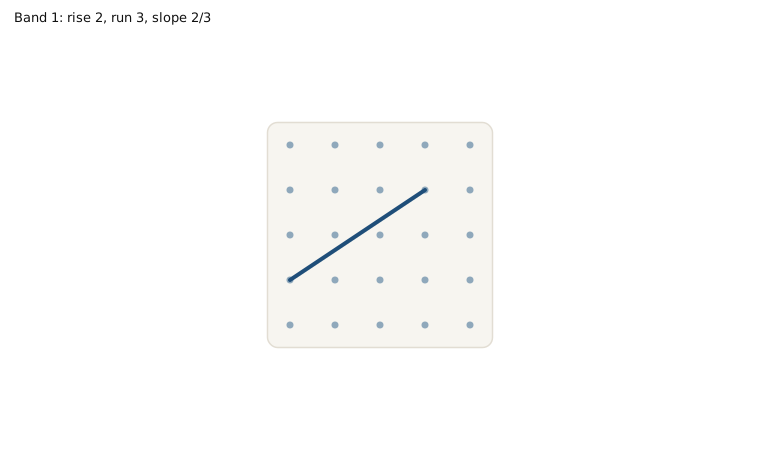

Doesn’t it look like a line?
Now we stretch one part of the rubber band straight up from the left peg and around a third peg to make the sides of a right triangle, as shown in Figure 4.20

We carefully make a 90º angle around the third peg, so one of the newly formed lines is vertical and the other is horizontal.
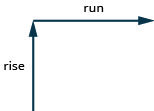
To find the slope of the line, we measure the distance along the vertical and horizontal sides of the triangle. The vertical distance is called the rise and the horizontal distance is called the run, as shown in Figure 4.21.
If our geoboard and rubber band look just like the one shown in Figure 4.22, the rise is 2. The rubber band goes up 2 units. (Each space is one unit.)
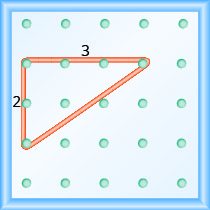
What is the run?
The rubber band goes across 3 units. The run is 3 (see Figure 4.22).
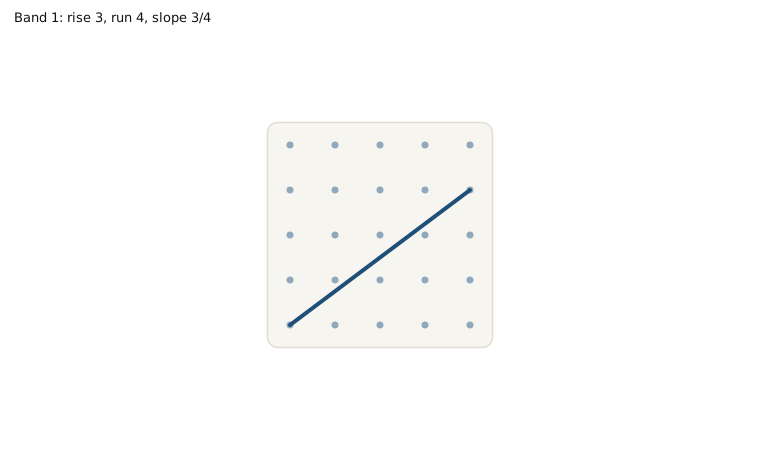
The slope of a line is the ratio of the rise to the run. In mathematics, it is always referred to with the letter .
What is the slope of the line on the geoboard in Figure 4.22?
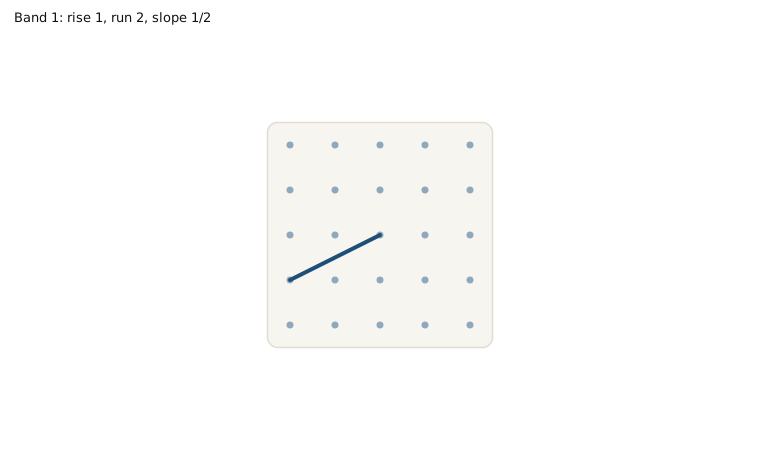
The line has slope . This means that the line rises 2 units for every 3 units of run.
When we work with geoboards, it is a good idea to get in the habit of starting at a peg on the left and connecting to a peg to the right. If the rise goes up it is positive and if it goes down it is negative. The run will go from left to right and be positive.
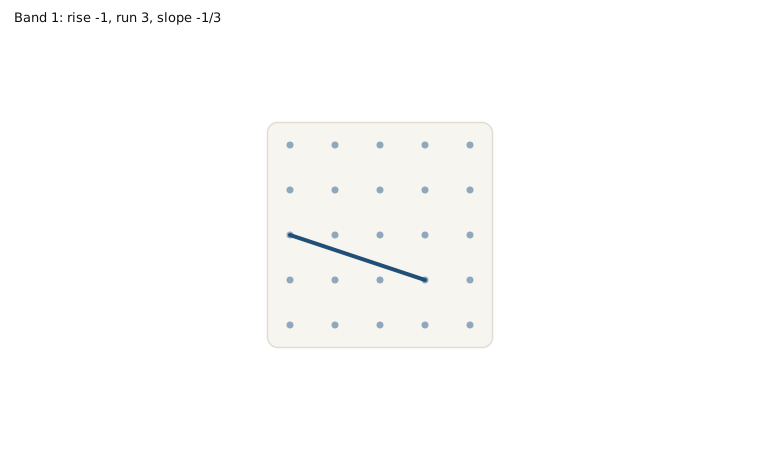
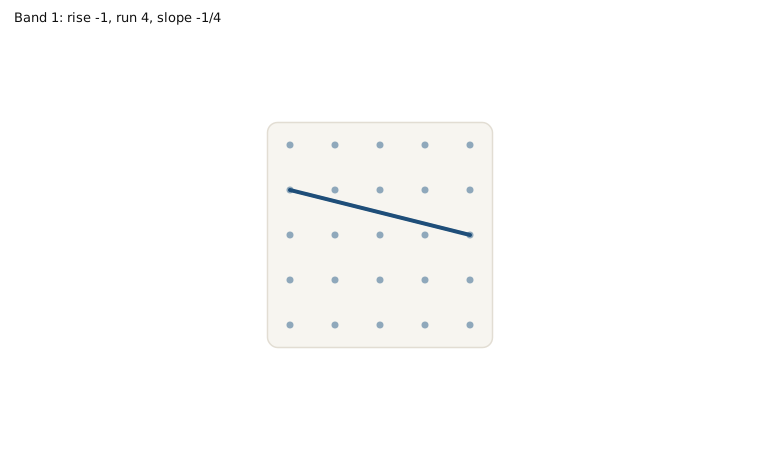
Notice that in Example 1 the slope is positive and in Example 2 the slope is negative. Do you notice any difference in the two lines shown in Figure 4.23(a) and Figure 4.23(b)?

We ‘read’ a line from left to right just like we read words in English. As you read from left to right, the line in Figure 4.23(a) is going up; it has positive slope. The line in Figure 4.23(b) is going down; it has negative slope.
Use to Find the Slope of a Line from its Graph
Now, we’ll look at some graphs on the -coordinate plane and see how to find their slopes. The method will be very similar to what we just modeled on our geoboards.
To find the slope, we must count out the rise and the run. But where do we start?
We locate two points on the line whose coordinates are integers. We then start with the point on the left and sketch a right triangle, so we can count the rise and run.
In the last two examples, the lines had y-intercepts with integer values, so it was convenient to use the y-intercept as one of the points to find the slope. In the next example, the y-intercept is a fraction. Instead of using that point, we’ll look for two other points whose coordinates are integers. This will make the slope calculations easier.
Find the Slope of Horizontal and Vertical Lines
Do you remember what was special about horizontal and vertical lines? Their equations had just one variable.
So how do we find the slope of the horizontal line ? One approach would be to graph the horizontal line, find two points on it, and count the rise and the run. Let’s see what happens when we do this.
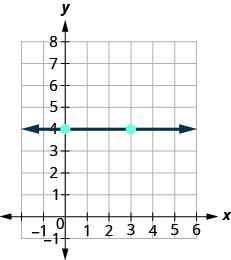
| What is the rise? | The rise is . |
|---|---|
| Count the run. | The run is . |
| What is the slope? | |
| The slope of the horizontal line is . |
All horizontal lines have slope 0. When the y-coordinates are the same, the rise is 0.
The floor of your room is horizontal. Its slope is 0. If you carefully placed a ball on the floor, it would not roll away.
Now, we’ll consider a vertical line, the line .
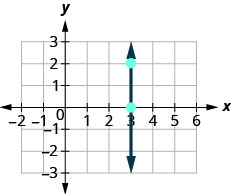
| What is the rise? | The rise is . |
|---|---|
| Count the run. | The run is . |
| What is the slope? |
But we can’t divide by 0. Division by 0 is not defined. So we say that the slope of the vertical line is undefined.
The slope of any vertical line is undefined. When the x-coordinates of a line are all the same, the run is 0.
Remember, we ‘read’ a line from left to right, just like we read written words in English.
Use the Slope Formula to find the Slope of a Line Between Two Points
Sometimes we’ll need to find the slope of a line between two points when we don’t have a graph to count out the rise and the run. We could plot the points on grid paper, then count out the rise and the run, but as we’ll see, there is a way to find the slope without graphing. Before we get to it, we need to introduce some algebraic notation.
We have seen that an ordered pair gives the coordinates of a point. But when we work with slopes, we use two points. How can the same symbol be used to represent two different points? Mathematicians use subscripts to distinguish the points.
The use of subscripts in math is very much like the use of last name initials in elementary school. Maybe you remember Laura C. and Laura M. in your third grade class?
We will use to identify the first point and to identify the second point.
If we had more than two points, we could use , , and so on.
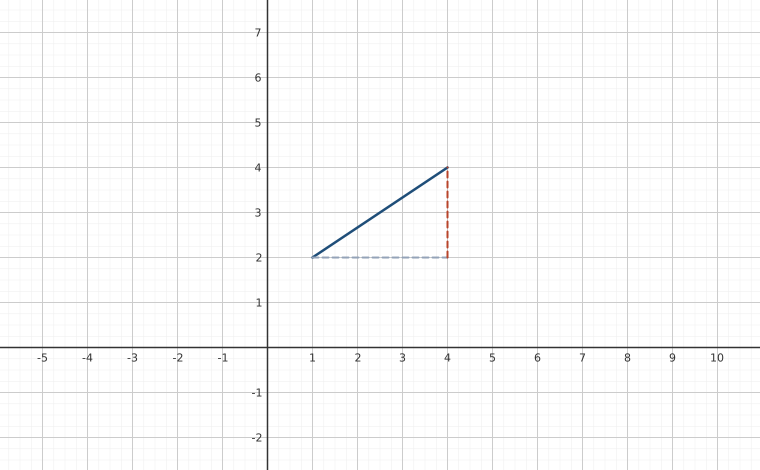
Let’s see how the rise and run relate to the coordinates of the two points by taking another look at the slope of the line between the points and .
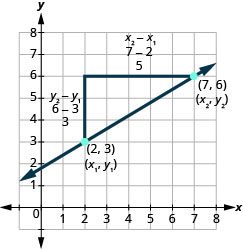
Since we have two points, we will use subscript notation, .
On the graph, we counted the rise of 3 and the run of 5.
Notice that the rise of 3 can be found by subtracting the y-coordinates 6 and 3.
And the run of 5 can be found by subtracting the x-coordinates 7 and 2.
We know . So .
We rewrite the rise and run by putting in the coordinates .
But 6 is , the y-coordinate of the second point and 3 is , the y-coordinate of the first point.
So we can rewrite the slope using subscript notation.
Also, 7 is , the x-coordinate of the second point and 2 is , the x-coordinate of the first point.
So, again, we rewrite the slope using subscript notation.
We’ve shown that is really another version of . We can use this formula to find the slope of a line when we have two points on the line.
Graph a Line Given a Point and the Slope
Up to now, in this chapter, we have graphed lines by plotting points, by using intercepts, and by recognizing horizontal and vertical lines.
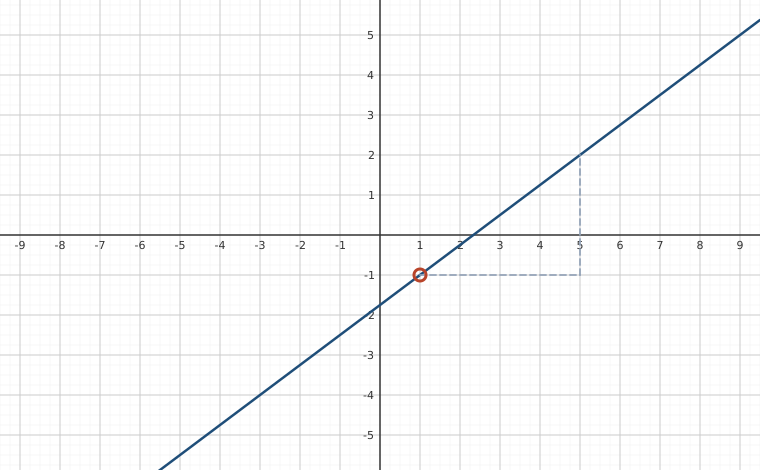
One other method we can use to graph lines is called the point–slope method. We will use this method when we know one point and the slope of the line. We will start by plotting the point and then use the definition of slope to draw the graph of the line.
Solve Slope Applications
At the beginning of this section, we said there are many applications of slope in the real world. Let’s look at a few now.
Key Concepts
- Find the Slope of a Line from its Graph using
- Locate two points on the line whose coordinates are integers.
- Starting with the point on the left, sketch a right triangle, with the hypotenuse going from the first point to the second point.
- Count the rise and the run on the legs of the triangle.
- Take the ratio of rise to run to find the slope.
- Graph a Line Given a Point and the Slope
- Plot the given point.
- Use the slope formula to identify the rise and the run.
- Starting at the given point, count out the rise and run to mark the second point.
- Connect the points with a line.
- Slope of a Horizontal Line
- The slope of a horizontal line, , is 0.
- Slope of a vertical line
- The slope of a vertical line, , is undefined
Practice Makes Perfect
Use Geoboards to Model Slope
In the following exercises, find the slope modeled on each geoboard.









In the following exercises, model each slope. Draw a picture to show your results.




Use to find the Slope of a Line from its Graph
In the following exercises, find the slope of each line shown.
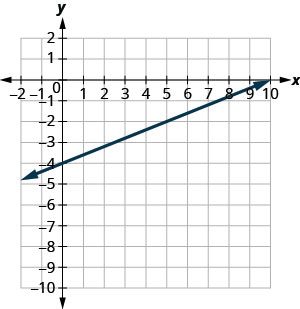
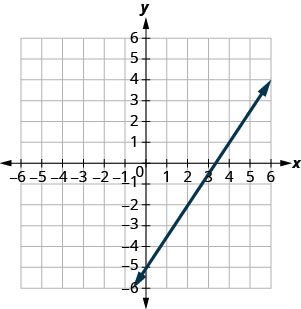
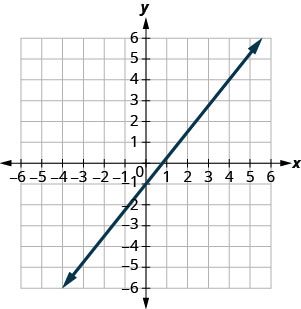
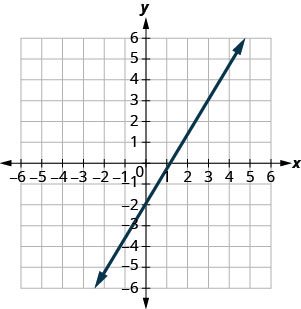
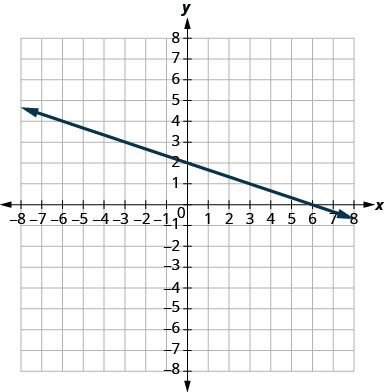
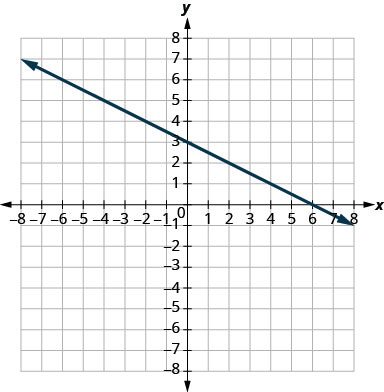
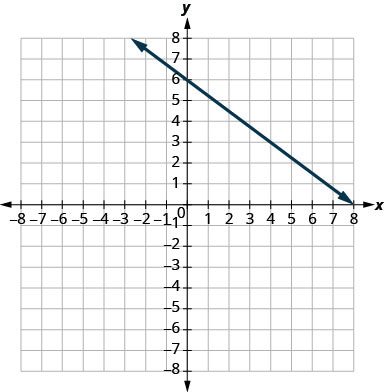
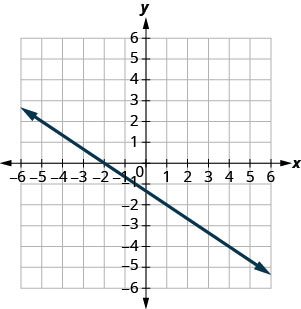
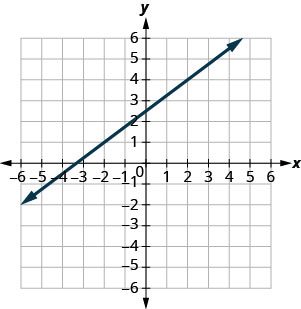
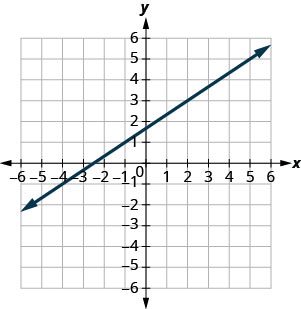
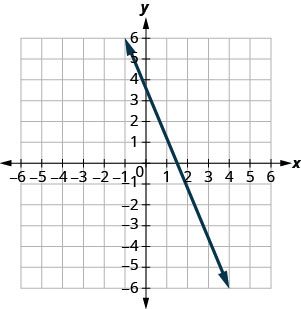
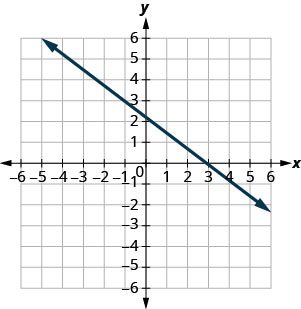
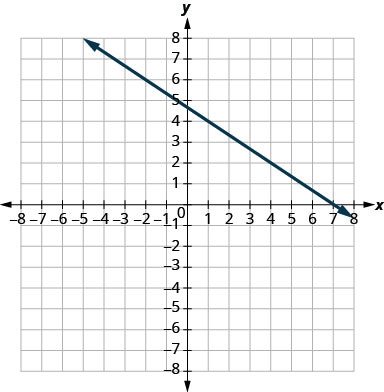
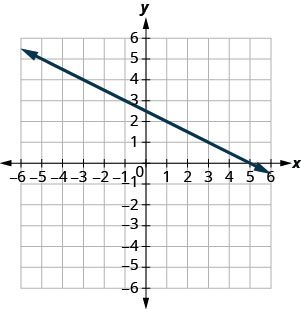
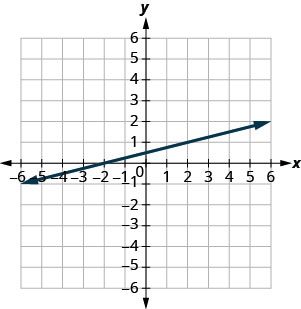
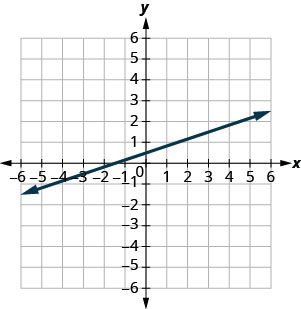
Find the Slope of Horizontal and Vertical Lines
In the following exercises, find the slope of each line.
0
undefined
0
undefined
Use the Slope Formula to find the Slope of a Line between Two Points
In the following exercises, use the slope formula to find the slope of the line between each pair of points.
Graph a Line Given a Point and the Slope
In the following exercises, graph each line with the given point and slope.
;
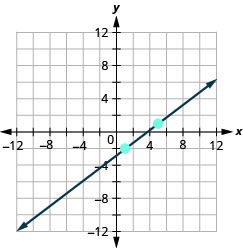
;
;
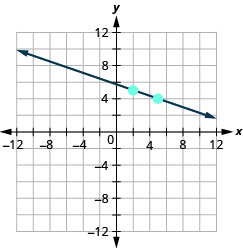
;
;
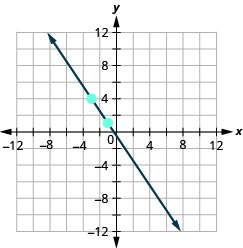
;
;
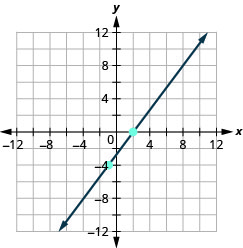
;
y-intercept 3;
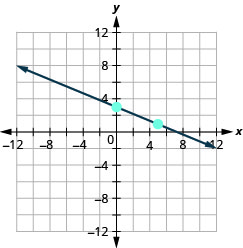
y-intercept 5;
x-intercept ;
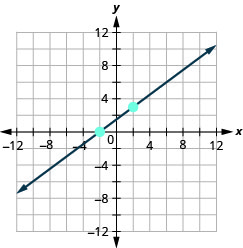
x-intercept ;
;
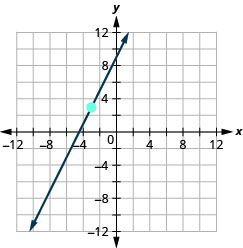
;
;
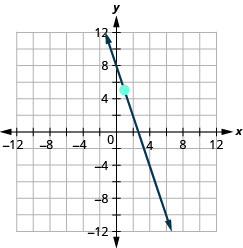
;
Everyday Math
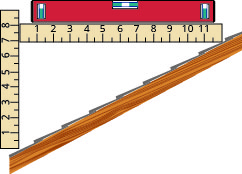
Slope of a roof. An easy way to determine the slope of a roof is to set one end of a 12 inch level on the roof surface and hold it level. Then take a tape measure or ruler and measure from the other end of the level down to the roof surface. This will give you the slope of the roof. Builders, sometimes, refer to this as pitch and state it as an “ 12 pitch” meaning , where is the measurement from the roof to the level—the rise. It is also sometimes stated as an “-in-12 pitch”.
- ⓐ What is the slope of the roof in this picture?
- ⓑ What is the pitch in construction terms?
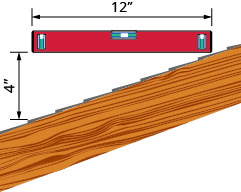
ⓐ ⓑ 4 12 pitch or 4-in-12 pitch
The slope of the roof shown here is measured with a 12” level and a ruler. What is the slope of this roof?
Road grade. A local road has a grade of 6%. The grade of a road is its slope expressed as a percent. Find the slope of the road as a fraction and then simplify. What rise and run would reflect this slope or grade?
; rise = 3, run = 50
Highway grade. A local road rises 2 feet for every 50 feet of highway.
- ⓐ What is the slope of the highway?
- ⓑ The grade of a highway is its slope expressed as a percent. What is the grade of this highway?
Wheelchair ramp. The rules for wheelchair ramps require a maximum 1-inch rise for a 12-inch run.
- ⓐ How long must the ramp be to accommodate a 24-inch rise to the door?
- ⓑ Create a model of this ramp.
ⓐ 288 inches (24 feet) ⓑ Models will vary.
Wheelchair ramp. A 1-inch rise for a 16-inch run makes it easier for the wheelchair rider to ascend a ramp.
- ⓐ How long must a ramp be to easily accommodate a 24-inch rise to the door?
- ⓑ Create a model of this ramp.
Writing Exercises
What does the sign of the slope tell you about a line?
When the slope is a positive number the line goes up from left to right. When the slope is a negative number the line goes down from left to right.
How does the graph of a line with slope differ from the graph of a line with slope ?
Why is the slope of a vertical line “undefined”?
A vertical line has 0 run and since division by 0 is undefined the slope is undefined.
Self Check
ⓐ After completing the exercises, use this checklist to evaluate your mastery of the objectives of this section.
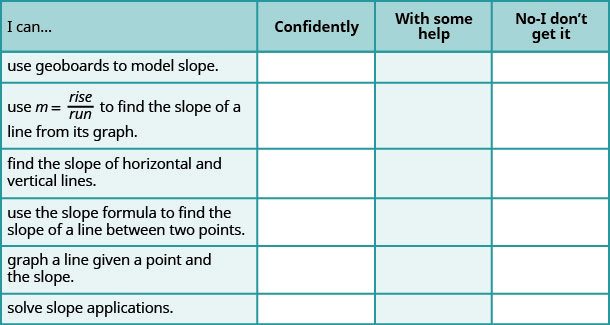
ⓑ On a scale of 1–10, how would you rate your mastery of this section in light of your responses on the checklist? How can you improve this?
Adapted from Elementary Algebra 2e by OpenStax (openstax.org), licensed under CC BY-NC-SA 4.0. Changes were made. License: CC-BY-NC-SA-4.0.