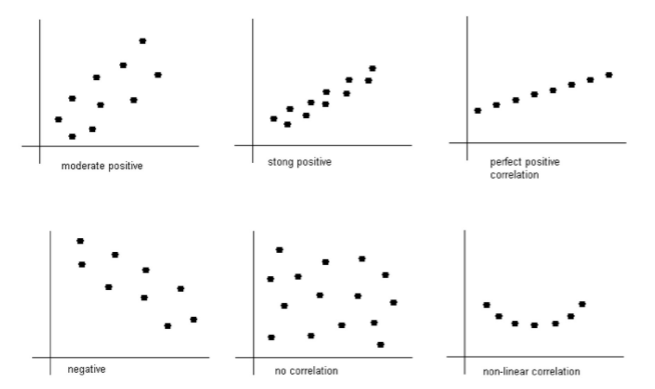
A correlation exists between two variables when the values of one variable are somehow associated with the values of the other variable.
When you see a pattern in the data you say there is a correlation in the data. Though this book is only dealing with linear patterns, patterns can be exponential, logarithmic, or periodic. To see this pattern, you can draw a scatter plot of the data.
Remember to read graphs from left to right, the same as you read words. If the graph goes up the correlation is positive and if the graph goes down the correlation is negative.
The words “ weak”, “moderate”, and “strong” are used to describe the strength of the relationship between the two variables.
Figures
The linear correlation coefficient is a number that describes the strength of the linear relationship between the two variables. It is also called the Pearson correlation coefficient after Karl Pearson who developed it. The symbol for the sample linear correlation coefficient is r. The symbol for the population correlation coefficient is (Greek letter rho).
The formula for r is
Where
Assumptions of linear correlation are the same as the assumptions for the regression line:
The set (x, y) of ordered pairs is a random sample from the population of all such possible (x, y) pairs.
For each fixed value of x, the y -values have a normal distribution. All of the y -distributions have the same variance, and for a given x-value, the distribution of y-values has a mean that lies on the least squares line. You also assume that for a fixed y, each x has its own normal distribution. This is difficult to figure out, so you can use the following to determine if you have a normal distribution.
Look to see if the scatter plot has a linear pattern.
Examine the residuals to see if there is randomness in the residuals. If there is a pattern to the residuals, then there is an issue in the data.
Causation
One common mistake people make is to assume that because there is a correlation, then one variable causes the other. This is usually not the case. That would be like saying the amount of alcohol in the beer causes it to have a certain number of calories. However, fermentation of sugars is what causes the alcohol content. The more sugars you have, the more alcohol can be made, and the more sugar, the higher the calories. It is actually the amount of sugar that causes both. Do not confuse the idea of correlation with the concept of causation. Just because two variables are correlated does not mean one causes the other to happen.
Remember a correlation only means a pattern exists. It does not mean that one variable causes the other variable to change.
Explained Variation
As stated before, there is some variability in the dependent variable values, such as calories. Some of the variation in calories is due to alcohol content and some is due to other factors. How much of the variation in the calories is due to alcohol content?
When considering this question, you want to look at how much of the variation in calories is explained by alcohol content and how much is explained by other variables. Realize that some of the changes in calories have to do with other ingredients. You can have two beers at the same alcohol content, but beer one has higher calories because of the other ingredients. Some variability is explained by the model and some variability is not explained. Together, both of these give the total variability. This is
To find the coefficient of determination, you square the correlation coefficient. In addition, is part of the calculator results.
Now that you have a correlation coefficient, how can you tell if it is significant or not? This will be answered in the next section.
These eBooks are a prerelease and are not yet certified conformant with WCAG 2.1 AA or ADA Title II. Every page is built against an automated accessibility gate, and the published editions will meet ADA Title II requirements when they release in late September 2026. If something is unusable, please tell us.