
8.1 Basics of Confidence Intervals
A point estimator is just the statistic that you have calculated previously. As an example, when you wanted to estimate the population mean, , the point estimator is the sample mean, . To estimate the population proportion, p, you use the sample proportion, . In general, if you want to estimate any population parameter, we will call it , you use the sample statistic, .
Point estimators are really easy to find, but they have some drawbacks. First, if you have a large sample size, then the estimate is better. But with a point estimator, you don’t know what the sample size is. Also, you don’t know how accurate the estimate is. Both of these problems are solved with a confidence interval.
Interpreting a confidence interval:
The statistical interpretation is that the confidence interval has a probability (1 - , where is the complement of the confidence level) of containing the population parameter. As an example, if you have a 95% confidence interval of 0.65 < p < 0.73, then you would say, “there is a 95% chance that the interval 0.65 to 0.73 contains the true population proportion.” This means that if you have 100 intervals, 95 of them will contain the true proportion, and 5% will not. The wrong interpretation is that there is a 95% chance that the true value of p will fall between 0.65 and 0.73. The reason that this interpretation is wrong is that the true value is fixed out there somewhere. You are trying to capture it with this interval. So this is the chance is that your interval captures it, and not that the true value falls in the interval.
There is also a real world interpretation that depends on the situation. It is where you are telling people what numbers you found the parameter to lie between. So your real world is where you tell what values your parameter is between. There is no probability attached to this statement. That probability is in the statistical interpretation.
The common probabilities used for confidence intervals are 90%, 95%, and 99%. These are known as the confidence level. The confidence level and the alpha level are related. For a two-tailed test, the confidence level is C = 1 - . This is because the is both tails and the confidence level is area between the two tails. As an example, for a two-tailed test ( is not equal to) with equal to 0.10, the confidence level would be 0.90 or 90%. If you have a one-tailed test, then your is only one tail. Because of symmetry the other tail is also . So you have 2 with both tails. So the confidence level, which is the area between the two tails, is C = 1 - 2.
One last thing to know about confidence is how the sample size and confidence level affect how wide the interval is. The following discussion demonstrates what happens to the width of the interval as you get more confident.
Think about shooting an arrow into the target. Suppose you are really good at that and that you have a 90% chance of hitting the bull’s eye. Now the bull’s eye is very small. Since you hit the bull’s eye approximately 90% of the time, then you probably hit inside the next ring out 95% of the time. You have a better chance of doing this, but the circle is bigger. You probably have a 99% chance of hitting the target, but that is a much bigger circle to hit. You can see, as your confidence in hitting the target increases, the circle you hit gets bigger. The same is true for confidence intervals. This is demonstrated in Figure .
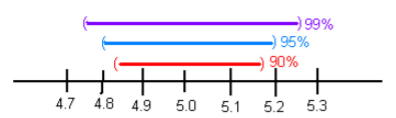
The higher level of confidence makes a wider interval. There’s a trade off between width and confidence level. You can be really confident about your answer but your answer will not be very precise. Or you can have a precise answer (small margin of error) but not be very confident about your answer.
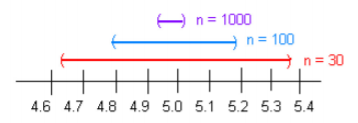
Now look at how the sample size affects the size of the interval. Suppose Figure represents confidence intervals calculated on a 95% interval. A larger sample size from a representative sample makes the width of the interval narrower. This makes sense. Large samples are closer to the true population so the point estimate is pretty close to the true value.
Now you know everything you need to know about confidence intervals except for the actual formula. The formula depends on which parameter you are trying to estimate. With different situations you will be given the confidence interval for that parameter.
Homework
Adapted from Statistics with Technology, 2nd Edition, by Kathryn Kozak (Coconino Community College), © Kathryn Kozak, licensed under CC BY-SA 4.0. Changes were made. License: CC-BY-SA-4.0.