
Regression Line
The function lin_reg(x,Y) below provides the slope, y-intercept of the least-squares regression line. In addition it returns the R-square, p-value, t-test statistic for testing the significance of the correlation coefficient.
def lin_reg(x,y):
    import statsmodels.api as sm
    import pandas as pd

    x_df = pd.DataFrame({'indpt':x})

    # to get intercept
    X = sm.add_constant(x_df)

    # fit the regression model
    model = sm.OLS(y, X)
    results = model.fit()
    print()
    if results.params.iloc[1]>0:
        r = results.rsquared**.5
    else: r = -1*results.rsquared**.5
    print('corr coeff r: ', r)
    print('R squared:', results.rsquared)
    print()
    print('estimated slope:', results.params.iloc[1])
    print('estimated y-intercept:', results.params.iloc[0])
    print()
    print('t test statistic:', results.tvalues.iloc[1])
    print('p-value:', results.f_pvalue)
    print()

    import matplotlib.pyplot as plt
    y_hat = results.predict(X)
    fig, ax = plt.subplots(figsize=(8,6))
    ax.plot(x, y, 'o', label="observed")
    ax.plot(x, y_hat, 'b-', label="reg line")
    ax.set_xlabel('indpt')
    ax.set_ylabel('dept')
    ax.legend(loc='best');
Example: The midterm exam, x, and final exam, y, scores for a random sample of 11 students is listed below. Find the slope and intercept of the regression line, correlation coefficient and draw a scatter plot.
| x | 65 | 67 | 71 | 71 | 66 | 75 | 67 | 70 | 71 | 69 | 69 |
|---|---|---|---|---|---|---|---|---|---|---|---|
| y | 145 | 133 | 185 | 163 | 126 | 198 | 153 | 163 | 159 | 151 | 159 |
x = [65, 67, 71, 71, 66, 75, 67, 70, 71, 69, 69]
y = [145, 133, 185, 163, 126, 198, 153, 163, 159, 151, 159]lin_reg(x,y)Show expected output
/usr/local/lib/python3.7/dist-packages/statsmodels/tools/_testing.py:19: FutureWarning:

pandas.util.testing is deprecated. Use the functions in the public API at pandas.testing instead.


corr coeff r:  0.8797451071731136
R squared: 0.7739514535950331

estimated slope: 6.364142538975502
estimated y-intercept: -282.5556792873052

t test statistic: 5.55107705058855
p-value: 0.0003559356815323585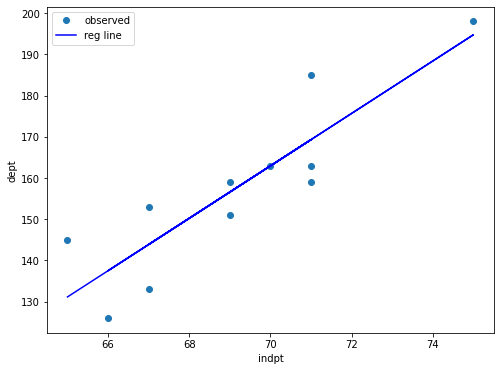
Interpretation: r=0.8797451071731136 indicates strong positive linear relationship. R squared: 0.7739514535950331 indicates 77.4% of the variation can be explained by the linear model. p-value: 0.0003559356815323585 indicates the correlation coefficient is significant.
Adapted from Python for Introductory Statistics, by Simon Aman (Truman College, City Colleges of Chicago), licensed under CC BY 4.0. Changes were made: reformatted as an accessible XYZ web edition with live in-browser code cells. License: CC-BY-4.0.