
14.10 Exercises
Selected answers
1. What is the equation for a regression line? What does each term in the line
refer to? (relevant
section)
2. The formula for a regression equation based on a sample size of 25 observations is Y' = 2X + 9. (a) What would be the predicted score for a person scoring 6 on X? (b) If someone's predicted score was 14, what was this person's score on X? (relevant section)
3. What criterion is used for deciding which regression line fits best? (relevant section)
4. What does the standard error of the estimate measure? What is the formula for the standard error of the estimate? (relevant section)
5. (a) In a regression analysis, the sum of squares for the predicted scores is 100 and the sum of squares error is 200, what is R2? (b) In a different regression analysis, 40% of the variance was explained. The sum of squares total is 1000. What is the sum of squares of the predicted values? (relevant section)
6. For the X,Y data below, compute:
(a) r and determine if it is significantly different from zero.
(b) the slope of the regression line and test if it differs significantly
from zero.
(c) the 95% confidence interval for the slope.
(relevant
section)
| X | Y |
|---|---|
| 2 | 5 |
| 4 | 6 |
| 4 | 7 |
| 5 | 11 |
| 6 | 12 |
7. What assumptions are needed to calculate the various inferential statistics
of linear regression? (relevant
section)
8. The correlation between years of education and salary in a sample of 20 people from a certain company is .4. Is this correlation statistically significant at the .05 level? (relevant section)
9. A sample of X and Y scores is taken, and a regression line is used to predict Y from X. If SSY' = 300, SSE = 500, and N = 50, what is: (relevant section relevant section)
(a) SSY?
(b) the standard error of the estimate?
(c) R2?
10. Using linear regression, find the predicted post-test score for someone with a score of 43 on the pre-test. (relevant section)
| Pre | Post |
|---|---|
| 59 | 56 |
| 52 | 63 |
| 44 | 55 |
| 51 | 50 |
| 42 | 66 |
| 42 | 48 |
| 41 | 58 |
| 45 | 36 |
| 27 | 13 |
| 63 | 50 |
| 54 | 81 |
| 44 | 56 |
| 50 | 64 |
| 47 | 50 |
| 55 | 63 |
| 49 | 57 |
| 45 | 73 |
| 57 | 63 |
| 46 | 46 |
| 60 | 60 |
| 65 | 47 |
| 64 | 73 |
| 50 | 58 |
| 74 | 85 |
| 59 | 44 |
11. The equation for a regression line predicting the number
of hours of TV watched by children (Y) from the number of hours
of TV watched by their parents (X) is Y' = 4 + 1.2X. The sample size is 12.
(a) If the
standard error of b is .4, is the slope statistically significant
at the .05 level? (relevant
section)
(b) If the mean of X is 8, what is the mean of Y? (relevant
section)
12. Based on the table below, compute the regression line that predicts Y from X. (relevant section)
| MX | MY | sX | sY | r |
|---|---|---|---|---|
| 10 | 12 | 2.5 | 3.0 | -0.6 |
13. Does A or B have a larger standard error of the estimate? (relevant section)
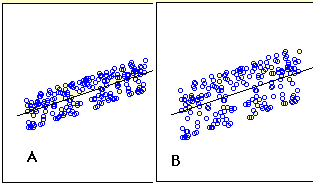
14. True/false: If the slope of a simple linear regression line is statistically significant, then the correlation will also always be significant. (relevant section)
15. True/false: If the slope of the relationship between X and Y is larger for Population 1 than for Population 2, the correlation will necessarily be larger in Population 1 than in Population 2. Why or why not? (relevant section)
16. True/false: If the correlation is .8, then 40% of the variance is explained. (relevant section)
17. True/false: If the actual Y score was 31, but the predicted score was 28, then the error of prediction is 3. (relevant section)
Questions from Case Studies:
The following question is from the Angry
Moods (AM) case study.
18. (AM#23) Find the regression line for predicting Anger-Out from Control-Out.
(a) What is the slope?
(b) What is the intercept?
(c) Is the relationship at least approximately linear?
(d) Test to see if the slope is significantly different from 0.
(e) What is the standard error of the estimate?
(relevant section, relevant
section, relevant section)
The following question is from the SAT
and GPA (SG) case study.
19. (SG#3) Find the regression line for predicting the overall university GPA from the high school GPA.
(a) What is the slope?
(b) What is the y-intercept?
(c) If someone had a 2.2 GPA in high school, what is the best estimate of
his or her college GPA?
(d) If someone had a 4.0 GPA in high school, what is the best estimate of
his or her college GPA?
(relevant section)
The following questions are from the Driving (D)
case study.
20. (D#5) What is the correlation between age and how often
the person chooses to drive in inclement weather? Is this correlation
statistically significant at the .01 level? Are older people more
or less likely to report that they drive in inclement weather?
(relevant section, relevant section )
21. (D#8) What is the correlation between how often a person chooses to
drive in inclement weather and the percentage of accidents the person believes
occur in inclement weather? Is this correlation significantly different from
0? (relevant section, relevant section )
22. (D#10) Use linear regression to predict how often someone rides public transportation in inclement weather from what percentage of accidents that person thinks occur in inclement weather. (Pubtran by Accident)
(a) Create a scatter plot of this data and add a regression
line.
(b) What is the slope?
(c) What is the intercept?
(d) Is the relationship at least approximately linear?
(e) Test if the slope is significantly different from 0.
(f) Comment on possible assumption violations for the test of the slope.
(g) What is the standard error of the estimate?
(relevant section, relevant section, relevant section)
Answers:
2) (a) 21
5) (a) .33
6) (b) b = 1.91
9) (a) 800
12) a = 19.2
18) (e) 3.45
19) (c) 2.6
20) r = .43
22) (b) .35
Adapted from Online Statistics Education: A Multimedia Course of Study (onlinestatbook.com), Project Leader: David M. Lane, Rice University. Developed with NSF support. The original work is in the public domain; it is cited here at the authors' request. Changes were made: reformatted as an accessible XYZ web edition with native MathML. License: Public-Domain.