
Login
📚 Online Statistics Education
Chapters ▾
⇩ Download ▾

8.3 3D Plots

Just as two-dimensional scatter plots show the data in two dimensions, 3D plots show data in three dimensions. Figure 1 shows a 3D scatter plot of the fat, non-sugar carbohydrates, and calories from a variety of cereal types.
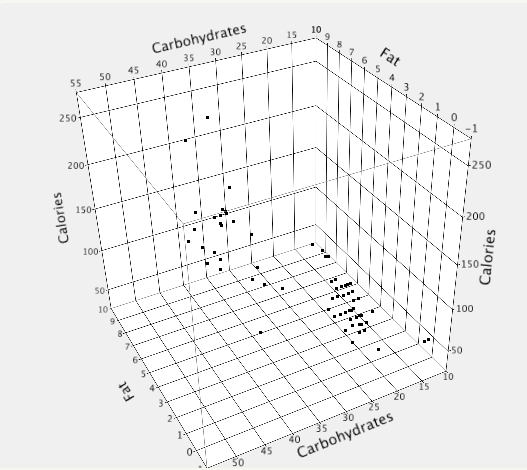
Three-dimensional scatterplot of breakfast cereals with axes Carbohydrates (10 to 55), Fat (0 to 10) and Calories (50 to 250), drawn as a wireframe box with dropped gridlines to each point. Most cereals cluster at low fat with carbohydrates between about 20 and 30 and calories between about 100 and 150; a few high-calorie points sit near the top of the box.
Figure 1. A 3D scatter plot showing fat, non-sugar carbohydrates, and calories from a variety of cereal types.

Many statistical packages allow you to rotate the axes interactively to view the data from a different vantage point. Figure 2 is an example.
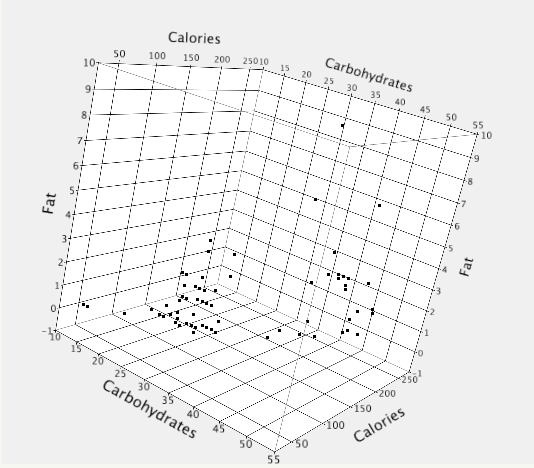
The same three cereal variables plotted in three dimensions but with the box rotated to a different vantage point, so Fat now runs up the left-hand axis and Calories along the top. The cluster of low-fat cereals now reads as a dense flat sheet near the bottom, and the spread in calories is easier to see than in the first orientation.
Figure 2. An alternative 3D scatter plot showing fat, non-sugar carbohydrates, and calories.

A fourth dimension can be represented as long as it is represented as a nominal variable. Figure 3 represents the different manufacturers by using different colors.
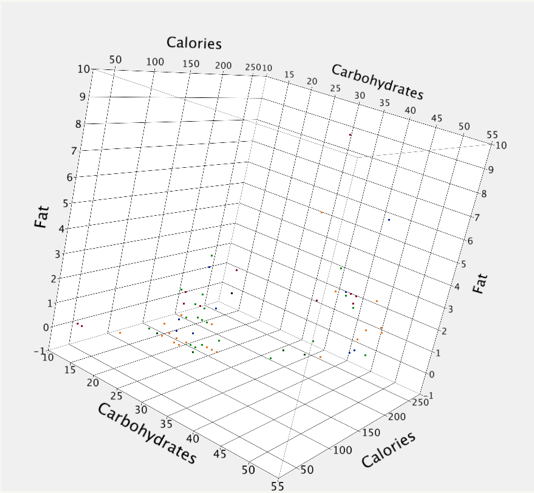
The same rotated cereal plot with a fourth, nominal variable added: each point is colored by manufacturer (red, blue, green and orange). The colors are interleaved through the main low-fat cluster rather than separating into distinct blocks.
Figure 3. The different manufacturers are color coded.

Interactively rotating 3D plots can sometimes reveal aspects of the data not otherwise apparent. Figure 4 shows data from a pseudo random number generator. Figure 4 does not show anything systematic and the random number generator appears to generate data with properties similar to those of true random numbers.
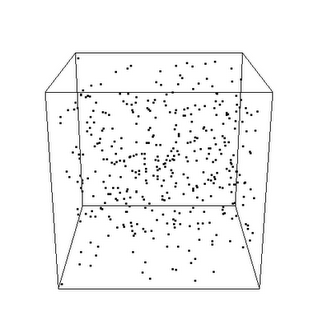
Three-dimensional scatterplot of 400 X, Y, Z triples from a pseudo random number generator, shown inside a wireframe cube. From this vantage point the points look evenly and formlessly scattered throughout the cube — nothing systematic is visible, so the generator appears to behave like a true random source.
Figure 4. A 3D scatter plot showing 400 values of X, Y, and Z from a pseudo random number generator.

Figure 5 shows a different perspective on these data. Clearly they were not generated by a random process.
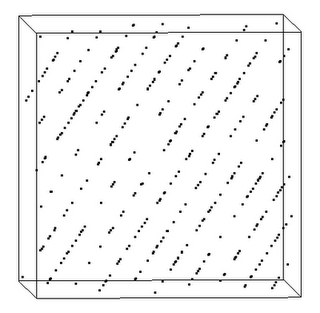
The same 400 pseudo-random triples viewed from a different angle. The points are no longer formless: they lie on a series of evenly spaced parallel diagonal planes running across the cube, with empty space between them. Rotating the plot exposes the lattice structure that the first view concealed — these values were not generated by a random process.
Figure 5. A different perspective on the 3D scatter plot showing 400 values of X, Y, and Z from a pseudo random number generator.

Figures 4 and 5 are reproduced with permission from R snippets by Bogumil Kaminski.

Adapted from Online Statistics Education: A Multimedia Course of Study (onlinestatbook.com), Project Leader: David M. Lane, Rice University. Developed with NSF support. The original work is in the public domain; it is cited here at the authors' request. Changes were made: reformatted as an accessible XYZ web edition with native MathML. License: Public-Domain.