Suppose that every year, only 10% of the fish in a lake have surviving offspring. If there were 100 fish in the lake last year, there would now be 110 fish. If there were 1000 fish in the lake last year, there would now be 1100 fish. Absent any inhibiting factors, populations of people and animals tend to grow by a percent of the existing population each year.
Suppose our lake began with 1000 fish, and 10% of the fish have surviving offspring each year. Since we start with 1000 fish, . How do we calculate ? The new population will be the old population, plus an additional 10%. Symbolically:
Notice this could be condensed to a shorter form by factoring:
While 10% is the growth rate, 1.10 is the growth multiplier. Notice that 1.10 can be thought of as “the original 100% plus an additional 10%”
For our fish population,
We could then calculate the population in later years:
Notice that in the first year, the population grew by 100 fish, in the second year, the population grew by 110 fish, and in the third year the population grew by 121 fish.
While there is a constant percentage growth, the actual increase in number of fish is increasing each year.
Graphing these values we see that this growth doesn’t quite appear linear.
To get a better picture of how this percentage-based growth affects things, we need an explicit form, so we can quickly calculate values further out in the future.
Like we did for the linear model, we will start building from the recursive equation:
Observing a pattern, we can generalize the explicit form to be:
, or equivalently,
From this, we can quickly calculate the number of fish in 10, 20, or 30 years:
Adding these values to our graph reveals a shape that is definitely not linear. If our fish population had been growing linearly, by 100 fish each year, the population would have only reached 4000 in 30 years compared to almost 18000 with this percent-based growth, called exponential growth.
In exponential growth, the population grows proportional to the size of the population, so as the population gets larger, the same percent growth will yield a larger numeric growth.
[1] www.eia.doe.gov/oiaf/1605/ggrpt/carbon.html
Adapted from Math in Society by David Lippman, hosted on LibreTexts (math.libretexts.org) and licensed under CC BY-SA 3.0. Changes were made. License: CC-BY-SA-3.0.
These eBooks are a prerelease and are not yet certified conformant with WCAG 2.1 AA or any other accessibility standard. Every page is built against an automated accessibility gate, and our target for the published editions is WCAG 2.2 Level AA. If something is unusable, please tell us.

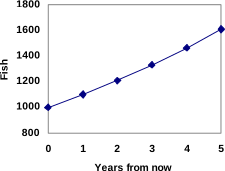 Graphing these values we see that this growth doesn’t quite appear linear.
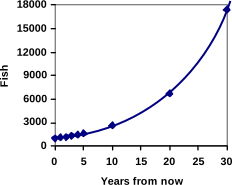 From this, we can quickly calculate the number of fish in 10, 20, or 30 years: