
10.3 Evaluate and Graph Logarithmic Functions
We have spent some time finding the inverse of many functions. It works well to ‘undo’ an operation with another operation. Subtracting ‘undoes’ addition, multiplication ‘undoes’ division, taking the square root ‘undoes’ squaring.
As we studied the exponential function, we saw that it is one-to-one as its graphs pass the horizontal line test. This means an exponential function does have an inverse. If we try our algebraic method for finding an inverse, we run into a problem.
To deal with this we define the logarithm function with base a to be the inverse of the exponential function We use the notation and say the inverse function of the exponential function is the logarithmic function.
Convert Between Exponential and Logarithmic Form
Since the equations and are equivalent, we can go back and forth between them. This will often be the method to solve some exponential and logarithmic equations. To help with converting back and forth let’s take a close look at the equations. See Figure 10.3. Notice the positions of the exponent and base.
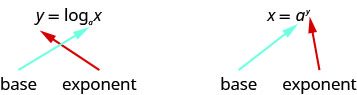
If we realize the logarithm is the exponent it makes the conversion easier. You may want to repeat, “base to the exponent give us the number.”
In the next example we do the reverse—convert logarithmic form to exponential form.
Evaluate Logarithmic Functions
We can solve and evaluate logarithmic equations by using the technique of converting the equation to its equivalent exponential equation.
When see an expression such as we can find its exact value two ways. By inspection we realize it means to what power will be Since we know An alternate way is to set the expression equal to and then convert it into an exponential equation.
Graph Logarithmic Functions
To graph a logarithmic function it is easiest to convert the equation to its exponential form, Generally, when we look for ordered pairs for the graph of a function, we usually choose an x-value and then determine its corresponding y-value. In this case you may find it easier to choose y-values and then determine its corresponding x-value.
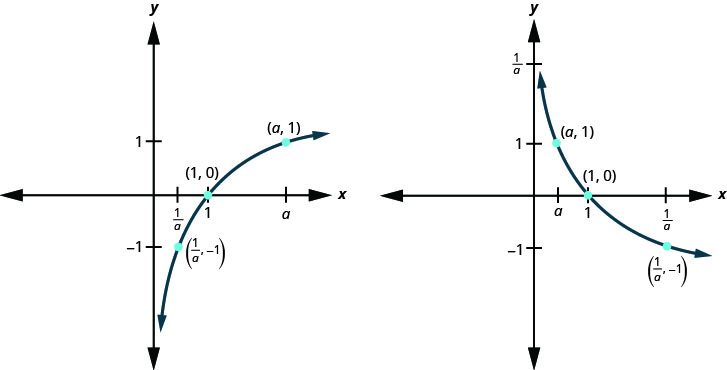
The graphs of and are the shape we expect from a logarithmic function where
We notice that for each function the graph contains the point This make sense because means which is true for any a.
The graph of each function, also contains the point This makes sense as means which is true for any a.
Notice too, the graph of each function also contains the point This makes sense as means which is true for any a.
Look at each graph again. Now we will see that many characteristics of the logarithm function are simply ’mirror images’ of the characteristics of the corresponding exponential function.
What is the domain of the function? The graph never hits the y-axis. The domain is all positive numbers. We write the domain in interval notation as
What is the range for each function? From the graphs we can see that the range is the set of all real numbers. There is no restriction on the range. We write the range in interval notation as
When the graph approaches the y-axis so very closely but will never cross it, we call the line the y-axis, a vertical asymptote.
Our next example looks at the graph of when
Now, let’s look at the graphs and , so we can identify some of the properties of logarithmic functions where
The graphs of all have the same basic shape. While this is the shape we expect from a logarithmic function where
We notice, that for each function again, the graph contains the points, This make sense for the same reasons we argued above.
We notice the domain and range are also the same—the domain is and the range is The -axis is again the vertical asymptote.
We will summarize these properties in the chart below. Which also include when
We talked earlier about how the logarithmic function is the inverse of the exponential function The graphs in Figure 10.4 show both the exponential (blue) and logarithmic (red) functions on the same graph for both and
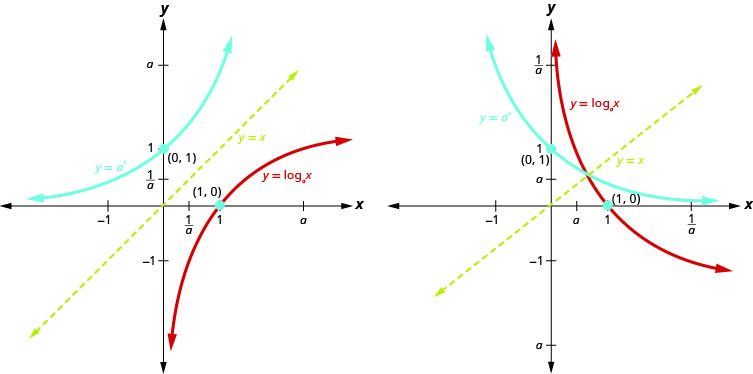
Notice how the graphs are reflections of each other through the line We know this is true of inverse functions. Keeping a visual in your mind of these graphs will help you remember the domain and range of each function. Notice the x-axis is the horizontal asymptote for the exponential functions and the y-axis is the vertical asymptote for the logarithmic functions.
Solve Logarithmic Equations
When we talked about exponential functions, we introduced the number e. Just as e was a base for an exponential function, it can be used a base for logarithmic functions too. The logarithmic function with base e is called the natural logarithmic function. The function is generally written and we read it as “el en of
When the base of the logarithm function is 10, we call it the common logarithmic function and the base is not shown. If the base a of a logarithm is not shown, we assume it is 10.

To solve logarithmic equations, one strategy is to change the equation to exponential form and then solve the exponential equation as we did before. As we solve logarithmic equations, , we need to remember that for the base a, and Also, the domain is Just as with radical equations, we must check our solutions to eliminate any extraneous solutions.
Use Logarithmic Models in Applications
There are many applications that are modeled by logarithmic equations. We will first look at the logarithmic equation that gives the decibel (dB) level of sound. Decibels range from 0, which is barely audible to 160, which can rupture an eardrum. The in the formula represents the intensity of sound that is barely audible.
The magnitude of an earthquake is measured by a logarithmic scale called the Richter scale. The model is where is the intensity of the shock wave. This model provides a way to measure earthquake intensity.
Key Concepts
- Properties of the Graph of
when when Domain Domain Range Range x-intercept x-intercept y-intercept none y-intercept none Contains Contains Asymptote y-axis Asymptote y-axis Basic shape increasing Basic shape decreasing
- Decibel Level of Sound: The loudness level, , measured in decibels, of a sound of intensity, , measured in watts per square inch is
- Earthquake Intensity: The magnitude of an earthquake is measured by where is the intensity of its shock wave.
Practice Makes Perfect
Convert Between Exponential and Logarithmic Form
In the following exercises, convert from exponential to logarithmic form.
In the following exercises, convert each logarithmic equation to exponential form.
Evaluate Logarithmic Functions
In the following exercises, find the value of in each logarithmic equation.
In the following exercises, find the exact value of each logarithm without using a calculator.
2
0
Graph Logarithmic Functions
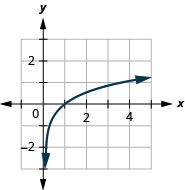
In the following exercises, graph each logarithmic function.
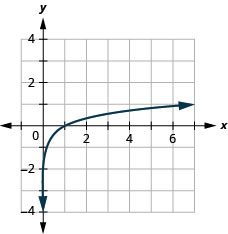
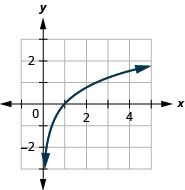
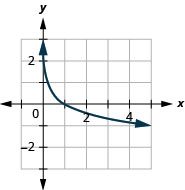
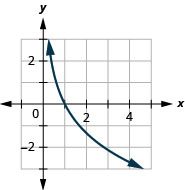
Solve Logarithmic Equations
In the following exercises, solve each logarithmic equation.
Use Logarithmic Models in Applications
In the following exercises, use a logarithmic model to solve.
What is the decibel level of normal conversation with intensity watts per square inch?
What is the decibel level of a whisper with intensity watts per square inch?
A whisper has a decibel level of 20 dB.
What is the decibel level of the noise from a motorcycle with intensity watts per square inch?
What is the decibel level of the sound of a garbage disposal with intensity watts per square inch?
The sound of a garbage disposal has a decibel level of 100 dB.
In 2014, Chile experienced an intense earthquake with a magnitude of on the Richter scale. In 2010, Haiti also experienced an intense earthquake which measured on the Richter scale. Compare the intensities of the two earthquakes.
The Los Angeles area experiences many earthquakes. In 1994, the Northridge earthquake measured magnitude of on the Richter scale. In 2014, Los Angeles also experienced an earthquake which measured on the Richter scale. Compare the intensities of the two earthquakes.
The intensity of the 1994 Northridge earthquake in the Los Angeles area was about 40 times the intensity of the 2014 earthquake.
Writing Exercises
Explain how to change an equation from logarithmic form to exponential form.
Explain the difference between common logarithms and natural logarithms.
Answers will vary.
Explain why
Explain how to find the on your calculator.
Answers will vary.
Self Check
ⓐ
After completing the exercises, use this checklist to evaluate your mastery of the objectives of this section.
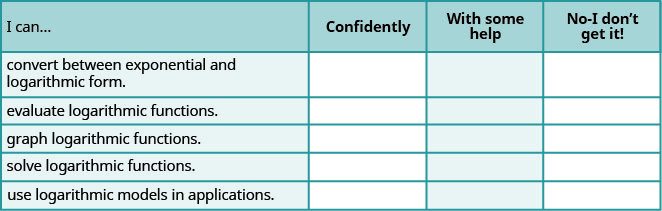
ⓑ After reviewing this checklist, what will you do to become confident for all objectives?
Adapted from Intermediate Algebra 2e by OpenStax (openstax.org), licensed under CC BY-NC-SA 4.0. Changes were made. License: CC-BY-NC-SA-4.0.