
4.2 Intensity in Single-Slit Diffraction
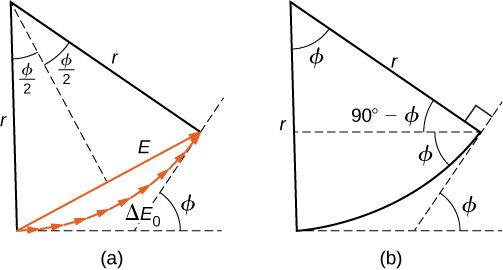
To calculate the intensity of the diffraction pattern, we follow the phasor method used for calculations with ac circuits in Alternating-Current Circuits. If we consider that there are N Huygens sources across the slit shown in Figure 4.4, with each source separated by a distance a/N from its adjacent neighbors, the path difference between waves from adjacent sources reaching the arbitrary point P on the screen is This distance is equivalent to a phase difference of The phasor diagram for the waves arriving at the point whose angular position is is shown in Figure 4.7. The amplitude of the phasor for each Huygens wavelet is the amplitude of the resultant phasor is E, and the phase difference between the wavelets from the first and the last sources is
With , the phasor diagram approaches a circular arc of length and radius r. Since the length of the arc is for any , the radius r of the arc must decrease as increases (or equivalently, as the phasors form tighter spirals).
The phasor diagram for (the center of the diffraction pattern) is shown in Figure 4.8(a) using . In this case, the phasors are laid end to end in a straight line of length the radius r goes to infinity, and the resultant has its maximum value The intensity of the light can be obtained using the relation from Electromagnetic Waves. The intensity of the maximum is then
where . The phasor diagrams for the first two zeros of the diffraction pattern are shown in parts (b) and (d) of the figure. In both cases, the phasors add to zero, after rotating through rad for and rad for .
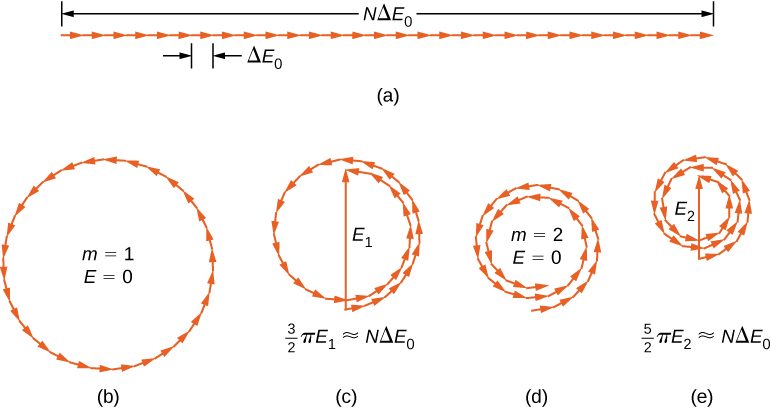
The next two maxima beyond the central maxima are represented by the phasor diagrams of parts (c) and (e). In part (c), the phasors have rotated through rad and have formed a resultant phasor of magnitude . The length of the arc formed by the phasors is Since this corresponds to 1.5 rotations around a circle of diameter , we have
so
and
where
In part (e), the phasors have rotated through rad, corresponding to 2.5 rotations around a circle of diameter and arc length This results in . The proof is left as an exercise for the student (Exercise 4.119).
These two maxima actually correspond to values of slightly less than rad and rad. Since the total length of the arc of the phasor diagram is always the radius of the arc decreases as increases. As a result, and turn out to be slightly larger for arcs that have not quite curled through rad and rad, respectively. The exact values of for the maxima are investigated in Exercise 4.120. In solving that problem, you will find that they are less than, but very close to,
To calculate the intensity at an arbitrary point P on the screen, we return to the phasor diagram of Figure 4.7. Since the arc subtends an angle at the center of the circle,
and
where E is the amplitude of the resultant field. Solving the second equation for E and then substituting r from the first equation, we find
Now defining
we obtain
This equation relates the amplitude of the resultant field at any point in the diffraction pattern to the amplitude at the central maximum. The intensity is proportional to the square of the amplitude, so
where is the intensity at the center of the pattern.
For the central maximum, , is also zero and we see from l’Hôpital’s rule that so that For the next maximum, rad, we have rad and when substituted into Equation 4.4, it yields
in agreement with what we found earlier in this section using the diameters and circumferences of phasor diagrams. Substituting rad into Equation 4.4 yields a similar result for .
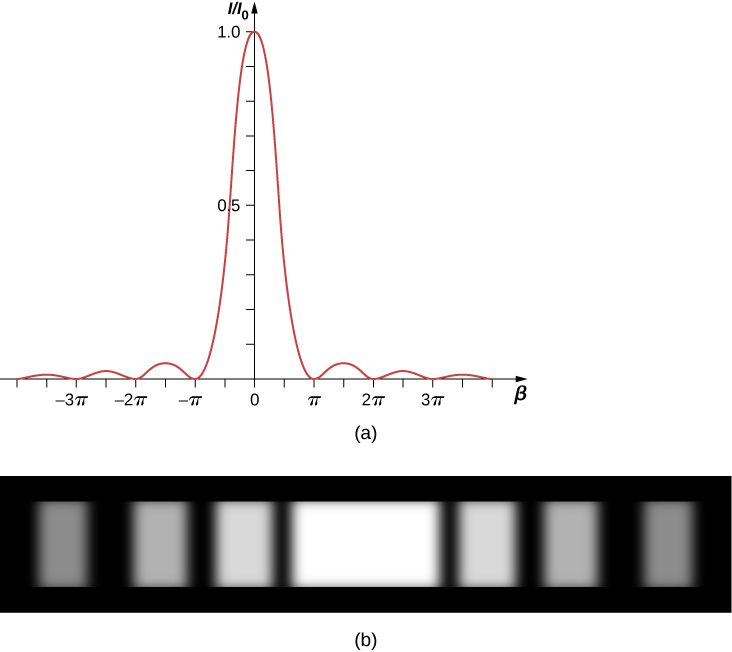
A plot of Equation 4.4 is shown in Figure 4.9 and directly below it is a photograph of an actual diffraction pattern. Notice that the central peak is much brighter than the others, and that the zeros of the pattern are located at those points where which occurs when rad. This corresponds to
or
which is Equation 4.1.
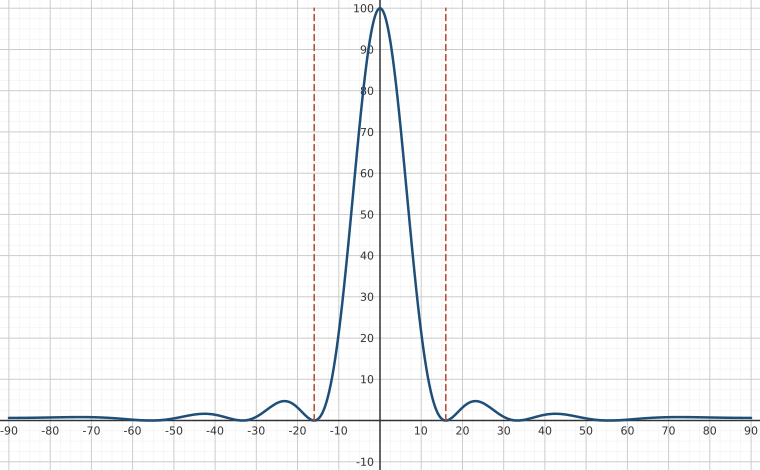
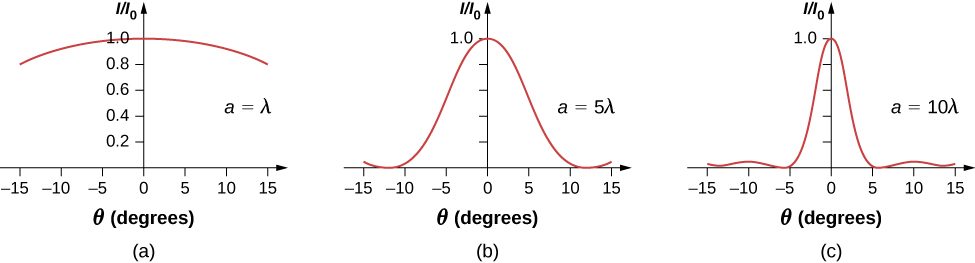
If the slit width a is varied, the intensity distribution changes, as illustrated in Figure 4.10. The central peak is distributed over the region from to . For small , this corresponds to an angular width Hence, an increase in the slit width results in a decrease in the width of the central peak. For a slit with the central peak is very sharp, whereas if , it becomes quite broad.
Summary
- The intensity pattern for diffraction due to a single slit can be calculated using phasors as
where , a is the slit width, is the wavelength, and is the angle from the central peak.
Conceptual Questions
In Equation 4.4, the parameter looks like an angle but is not an angle that you can measure with a protractor in the physical world. Explain what represents.
The parameter is the arc angle shown in the phasor diagram in Figure 4.7. The phase difference between the first and last Huygens wavelet across the single slit is and is related to the curvature of the arc that forms the resultant phasor that determines the light intensity.
Problems
A single slit of width is illuminated by a sodium yellow light of wavelength 589 nm. Find the intensity at a angle to the axis in terms of the intensity of the central maximum.
A single slit of width 0.1 mm is illuminated by a mercury light of wavelength 576 nm. Find the intensity at a angle to the axis in terms of the intensity of the central maximum.
The width of the central peak in a single-slit diffraction pattern is 5.0 mm. The wavelength of the light is 600 nm, and the screen is 2.0 m from the slit. (a) What is the width of the slit? (b) Determine the ratio of the intensity at 4.5 mm from the center of the pattern to the intensity at the center.
Consider the single-slit diffraction pattern for , , and . Find the intensity in terms of at , , , , and .
Adapted from University Physics Volume 3 by OpenStax (openstax.org), licensed under CC BY-NC-SA 4.0. Changes were made. License: CC-BY-NC-SA-4.0.