
1.6 Venn Mnemonic for the Rules of Probability
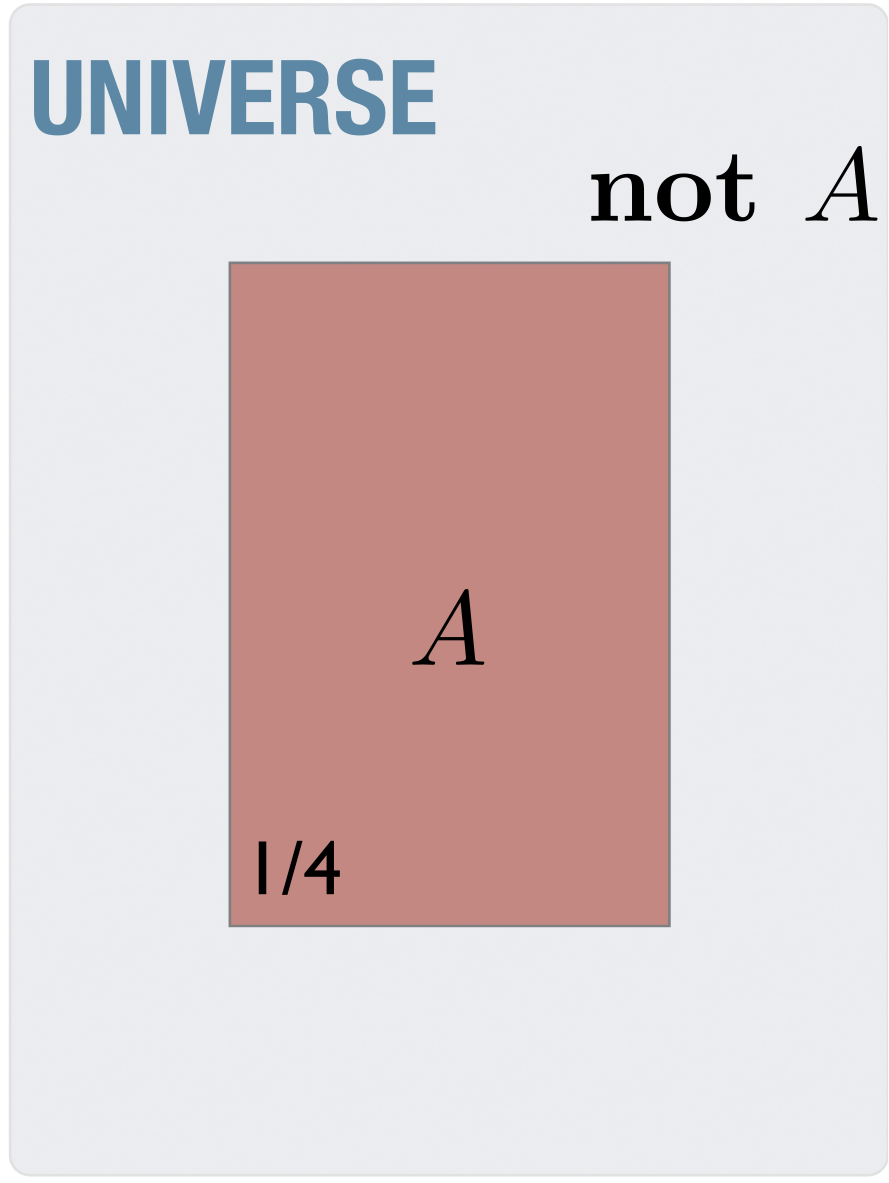
It is often useful to have a picture to represent the mathematics, so that it is easier to remember the equations and to understand their meaning. It is common to use what is called a Venn Diagram to represent probabilities in an intuitive, graphical way. The idea is that probabilities are represented as the fractional area of simple geometric shapes. We can then find a picture representation of each of the rules of probability. We start by looking at a sample Venn Diagram, in Figure 1.2.
The fractional area of the rectangle represents the probability , and can be thought of as a probability of one of the statements we've explored, such as . This diagram is strictly a mnemonic, because the individual points on the diagram are not properly defined. The diagram in Figure 1.2 also represents the Negation Rule (Equation 1.7),
In the diagram it is easy to see that the sum of the areas inside of (i.e. 1/4) and outside of (i.e. 3/4) cover the entire area of the Universe of statements, and thus add up to 1.
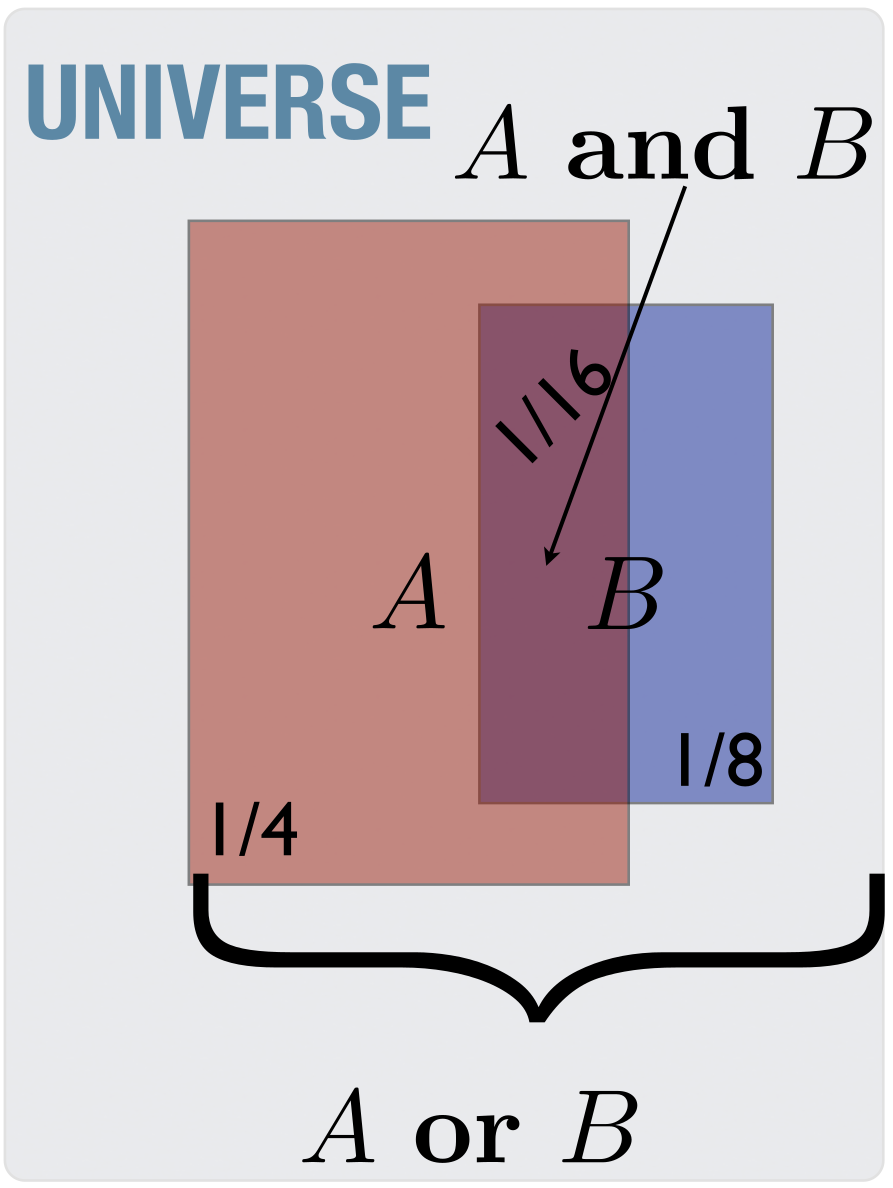
Figure 1.3 shows the diagram which can help us remember the sum and product rules. The Sum Rule (Equation 1.10)
is represented in the total area occupied by the rectangles and , and makes up all of (i.e. 1/4) and the half of sticking out (i.e. 1/8-1/16=1/16) yielding . This is also the area of each added up (1/4+1/8), but subtracting the intersection (1/16) because otherwise it is counted twice. Adding the areas this way directly parallels the Sum Rule.
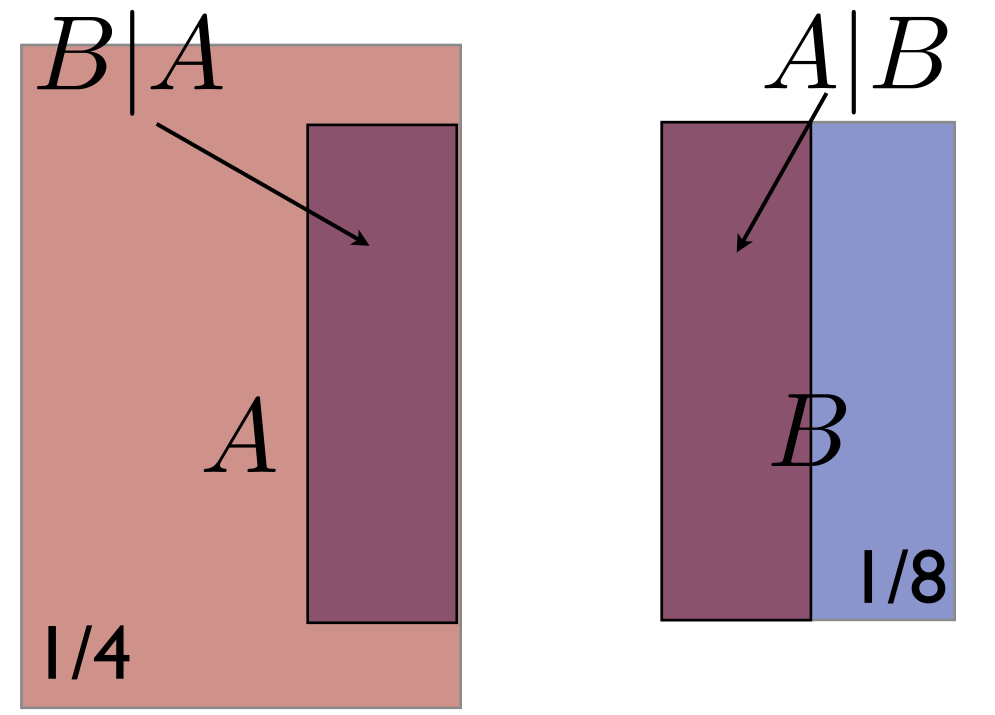
Conditional probabilities, like those that come into the Product Rule (Equation 1.8) and Bayes Rule (Equation 1.14) are a little more challenging to visualize. In Figure 1.4, is represented by the fraction of the darker area (which was originally part of ) compared not to the Universe but to the area of , and thus represents . In a way, it is as if the conditional symbol, “,” defines the Universe with which to make the comparisons. On the left of Figure 1.4, the same darker area that was originally part of represents making up 1/4 of the area of . Thus . The Product Rule (Equation 1.8) then follows,
We can further see the special case of mutually exclusive statements shown in Figure 1.5. The Sum Rule for Exclusive Events (Equation 1.11) is simply the sum of the two areas because there is no overlap
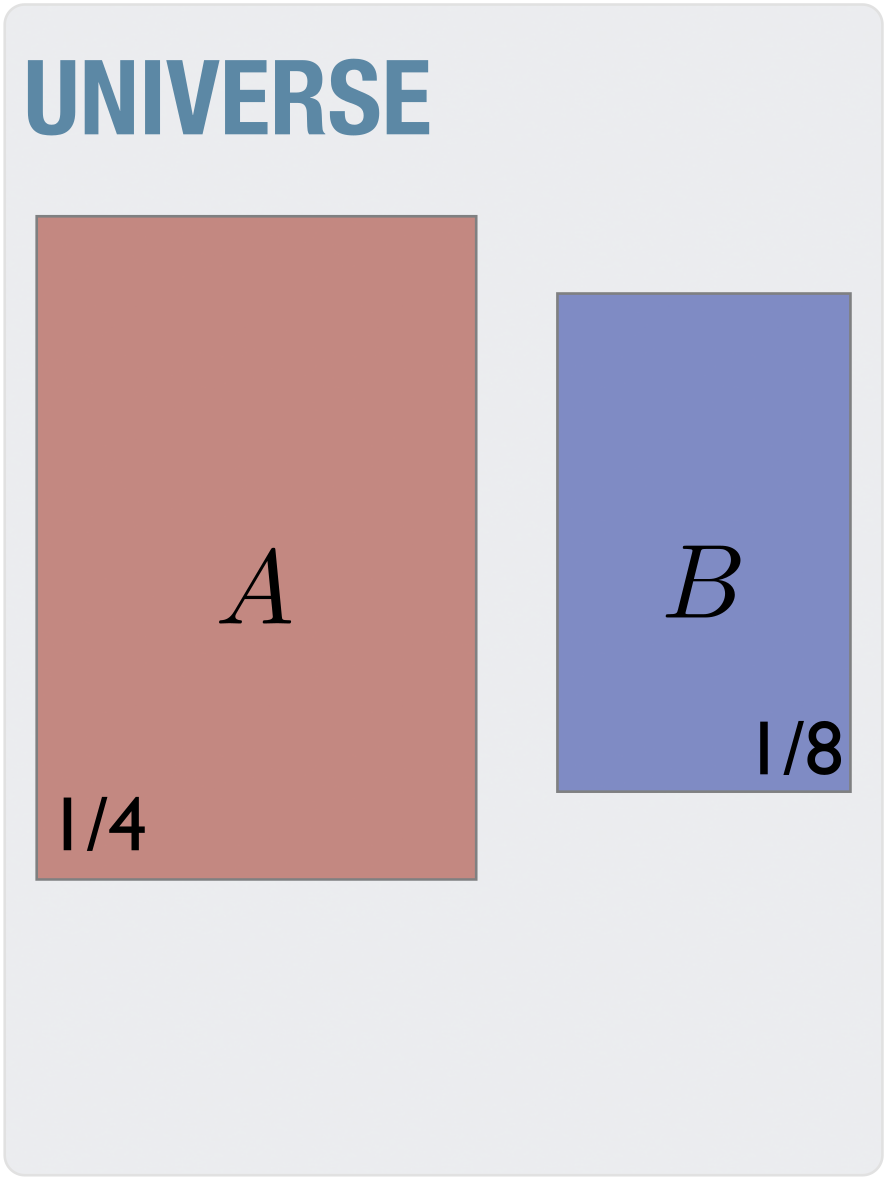
Further, it is straightforward to see from this diagram the following properties for mutually exclusive events
Adapted from Statistical Inference for Everyone, by Brian Blais (Bryant University), licensed under CC BY-SA 4.0 (dual-licensed under the GNU FDL 1.2 or later; this adaptation uses the CC BY-SA grant). Changes were made; this adaptation is distributed under the same license. License: CC-BY-SA-4.0.