The sampling distribution of the sample mean is the probability distribution for the possible values of the mean that results when random sample of size n are repeatedly drawn from the population with mean and standard deviation .
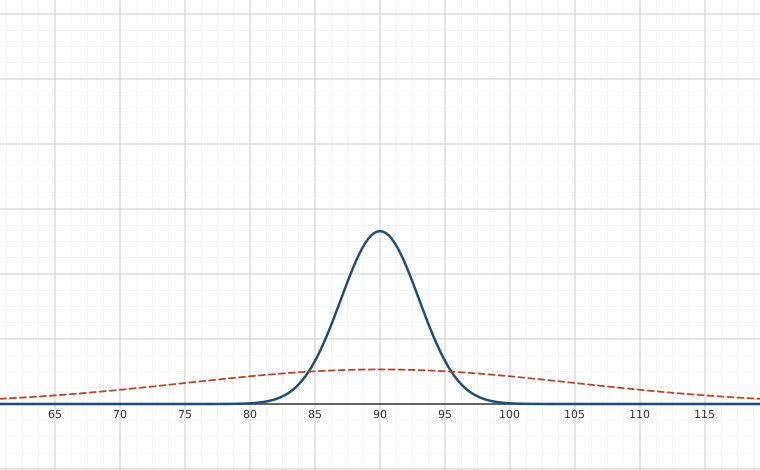
Interactive figureThe Central Limit Theorem: sample size is the whole lessonDrag the Sample size n slider from 1 to 50.
XYZ Graph · viewer build 5edf91b
The solid curve is the sampling distribution of the sample mean for this section's population - mu = 90, sigma = 15 - with the sample size n on a slider; the dashed curve is the population itself (n = 1) and never moves. Both are drawn in percent per unit of x-bar, so the two are directly comparable. Drag n from 1 to 50 and the solid curve does the only thing the theorem asserts: it stays centred on 90 and narrows, because its standard deviation is 15/sqrt(n) - 15 at n = 1, 3 at the book's n = 25, 2.12 at n = 50. The peak climbs in step (2.66, 13.3, 18.8 percent per unit) because the area underneath is always 1. That is why the first example's P(x-bar < 85) is only 0.0478 while a single observation below 85 would be unremarkable, and no static bell curve can show it, because the whole point is a family of curves indexed by n.
When the sample size is large or the samples are drawn from a population that is normally distributed with mean and standard deviation , the sampling distribution of the sample mean is approximately normal with mean and standard deviation of
Example: A normally distributed population has a mean of 90 and a standard deviation of 15. Samples of size n = 25 are drawn randomly from the population and the mean is computed.
Find the probability that sample mean is less than 85.
stats.norm.cdf(85,90,15/25**.5)
from scipy import stats
stats.norm.cdf(85,90,15/25**(1/2))
Show expected output
0.0477903522728147
Interpretation:
Example: A normally distributed population has a mean of 90 and a standard deviation of 15. Samples of size n = 25 are drawn randomly from the population and the mean is computed.
Find the probability that the sample mean is between 85 and 92.
from scipy import stats
stats.norm.cdf(92,90,15/25**.5)-stats.norm.cdf(85,90,15/25**.5)
Show expected output
0.6997171101802624
Interpretation:
Example: The mean age of tablet device users is 34 years. Suppose the standard deviation is 15 years. If a random sample of size n = 100 is drawn from this population:
Find the probability that the sample mean age is more than 30 years.
Find the 95th percentile for the sample mean age.
from scipy import stats
1-stats.norm.cdf(30,34,15/100**.5)
Show expected output
0.9961696194324102
Interpretation:
from scipy import stats
stats.norm.ppf(.95,34,15/100**.5)
Show expected output
36.46728044042721
Interpretation: Ninety-five percent of the sample means are less than or equal to 36.46728044042721
Example
The average score for an IQ test is 100 with a standard deviation of 15. Assume the test scores are normally distributed.
If a random sample of 25 test scores is selected from this population, what is the probability that the sample mean is between 90 and 110.
Find the 95th percentile for the sample mean score.
from scipy import stats
stats.norm.cdf(110,100,15/(25**.5))-stats.norm.cdf(90,100,15/(25**.5))
Show expected output
0.9991418793336064
Interpretation: The probability that the mean is between 90 and 110 is 0.9991418793336064. That is,
from scipy import stats
stats.norm.ppf(.95,100,15/(25**.5))
Show expected output
104.93456088085442
Interpretation: 95 percent of the test scores are less than or equal to 104.93456088085442.
Adapted from Python for Introductory Statistics, by Simon Aman (Truman College, City Colleges of Chicago), licensed under CC BY 4.0. Changes were made: reformatted as an accessible XYZ web edition with live in-browser code cells. License: CC-BY-4.0.
These eBooks are a prerelease and are not yet certified conformant with WCAG 2.1 AA or ADA Title II. Every page is built against an automated accessibility gate, and the published editions will meet ADA Title II requirements when they release in late September 2026. If something is unusable, please tell us.