
5.3 Conditional p Demo
This section is an interactive demonstration. The live simulation runs on the original site: open the demonstration at onlinestatbook.com.
Learning Objectives
- Compute conditional probabilities.
Instructions
The simulation shows a set of 30 objects varying in color (red, blue, and purple) and shape (X and O). One of the objects is to be chosen at random. The various possible conditional probabilities are shown below the objects. Click on one to see how the conditional probability is computed. For example, if you click on P(X|Red) which is read "the probability of X given Red" then a box is put around each of the red objects. Of these, those that are X's are shaded. The probability of X given it is red is the number of red X's (shaded boxes) divided by the total red items (the number of boxes).
Click "Another Example" for new distribution of objects.
Illustrated Instructions
This demonstration starts by presenting you with a dataset of red, blue and purple Xs and Os (see screenshot below). 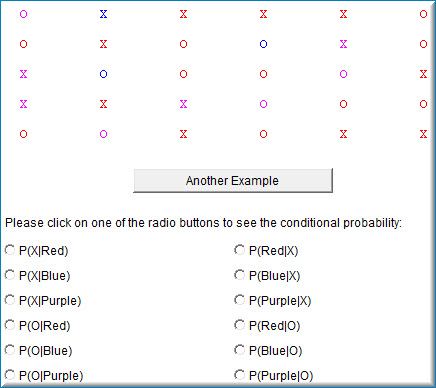
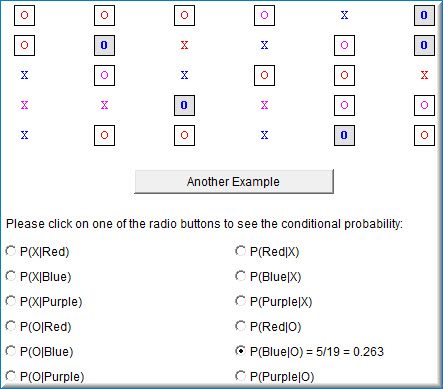
Selecting one of the conditional probabilities changes the display to show you how this probability would be calculated from the provided data.
The screenshot below shows the conditional probability for getting a selection being Blue given that it is a O. The demonstration shows Puts a square around all 19 Os in the data and a shaded square around the
5 blue Os.
Click "Another Example" for new distribution of objects.
We recommend you answer the questions even if you have to guess. Then use the simulation to help you help find the answer.
Select a conditional probability below to see it represented in the displayed data.
Adapted from Online Statistics Education: A Multimedia Course of Study (onlinestatbook.com), Project Leader: David M. Lane, Rice University. Developed with NSF support. The original work is in the public domain; it is cited here at the authors' request. Changes were made: reformatted as an accessible XYZ web edition with native MathML. License: Public-Domain.