
4.2 Reading Critical Points from the Map
Where , the terrain is momentarily flat: no direction climbs and none falls, to first order. Such critical points are where maxima and minima hide — but flatness alone does not say which, and a third possibility lurks: the saddle, uphill one way and downhill another. A contour map betrays the character of each critical point by a visual signature, and the discipline of this section is to read the map before touching the algebra.
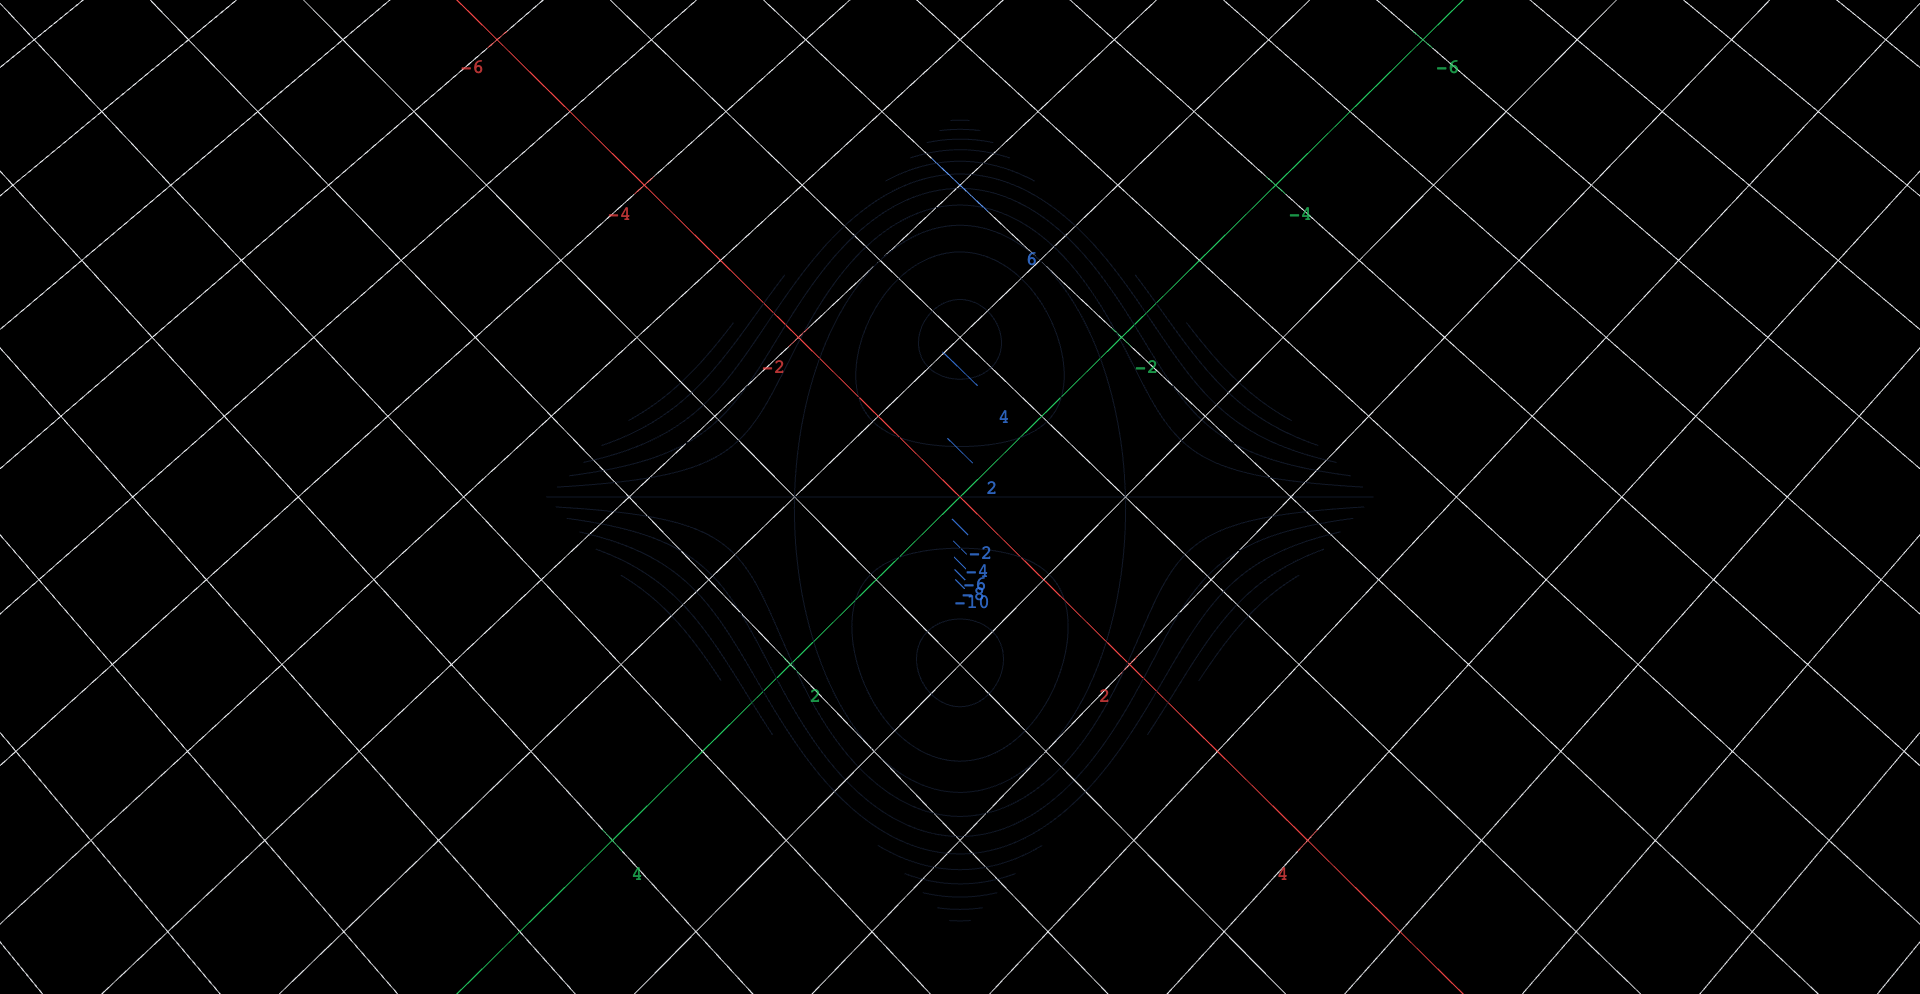 Explore in 3D (opens in a new tab)
Explore
- Zoom in on the corners near and and describe what the contour lines do there. A curve that passes through itself in an X is something no contour of Chapter 3's two-hill map ever did.
- On a hiking map, what does a family of nested closed loops around a point mean about the terrain? What would a trail through the X-point feel like underfoot — and why is "flat exactly at the crossing, tilted all around it" the only consistent answer?
- Classify all four points — , , , — as local max, local min, or saddle, using only the map. Write all four down before revealing anything.
- One classification the unlabeled map cannot make: of the two nested-oval families, which is the peak and which the pit? Explain why the map alone is ambiguous — then commit to a guess anyway.
- Reveal the four marker points and then the surface with their eye toggles, and orbit down from the top view. Which oval family holds the blue marker (the pit)? Was your step 4 guess right — and your step 3 reads?
- The saddle values here are exactly , and the contour sheet starts at . Drag the contour plot's z-offset slowly up and down through : the sheet passes through both saddle points at once, because the X-shaped curve is the level curve at saddle height. Nested ovals never touch their center point this way. (The level count of 17 is deliberate — an odd count places one level exactly at ; nudge the Levels control to an even count and the X dissolves into nearby hyperbola pairs. Set it back.)
The second derivative test
The signatures you just used are what the second derivative test formalizes. Near a critical point, is well approximated by a quadratic; the number
decides that quadratic's shape. If the quadratic is a bowl — upright if (local minimum), inverted if (local maximum) — and its level curves are nested ovals. If it is a saddle, and the level curve through the critical value crosses itself there: the X. If the test is silent. Step 4's ambiguity is real mathematics: oval shape determines the sign of , but peak-versus-pit needs the sign of (or labeled heights) — shapes alone cannot supply it.
The second-derivative test's is not a recipe — it is the determinant of the matrix of second partials, , , , arranged as stated in the solution above. The computer algebra system expands that determinant symbolically and lands on the same whose sign sorted all four critical points.
An original work of XYZ Homework, built around interactive XYZ 3D figures. Aligned to OpenStax Calculus Volume 3 (Strang & Herman), © OpenStax (Rice University), licensed CC BY-NC-SA 4.0; no OpenStax content is reproduced, and this work is not affiliated with or endorsed by OpenStax or Rice University. License: CC-BY-NC-SA-4.0.