
1.8 Income Taxation
Many people have proposed various revisions to the income tax collection in the United States. Some, for example, have claimed that a flat tax would be fairer. Others call for revisions to how different types of income are taxed, since currently investment income is taxed at a different rate than wage income.
The following two projects will allow you to explore some of these ideas and draw your own conclusions.
Project 1: Flat tax, Modified Flat Tax, and Progressive Tax.
Imagine the country is made up of 100 households. The federal government needs to collect $800,000 in income taxes to be able to function. The population consists of 6 groups:
Group A: 20 households that earn $12,000 each
Group B: 20 households that earn $29,000 each
Group C: 20 households that earn $50,000 each
Group D: 20 households that earn $79,000 each
Group E: 15 households that earn $129,000 each
Group F: 5 households that earn $295,000 each
This scenario is roughly proportional to the actual United States population and tax needs. We are going to determine new income tax rates.
The first proposal we’ll consider is a flat tax – one where every income group is taxed at the same percentage tax rate.
1) Determine the total income for the population (all 100 people together)
2) Determine what flat tax rate would be necessary to collect enough money.
The second proposal we’ll consider is a modified flat-tax plan, where everyone only pays taxes on any income over $20,000. So, everyone in group A will pay no taxes. Everyone in group B will pay taxes only on $9,000.
3) Determine the total taxable income for the whole population
4) Determine what flat tax rate would be necessary to collect enough money in this modified system
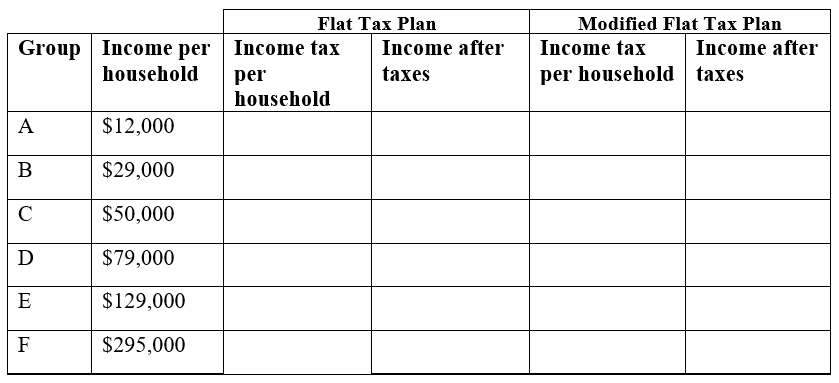
5) Complete this table for both the plans
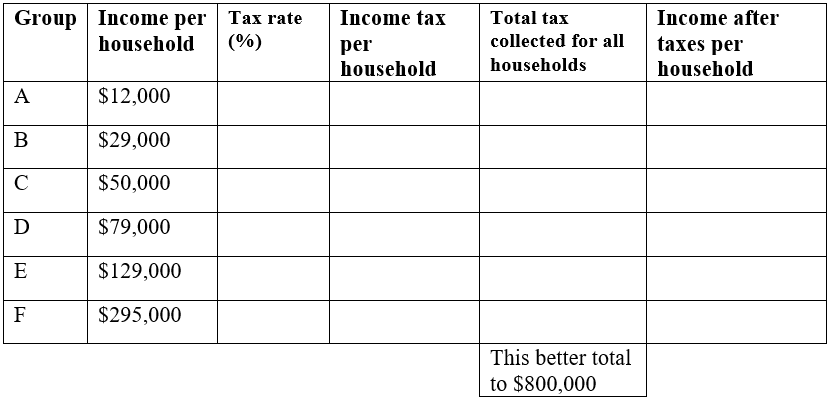
The third proposal we’ll consider is a progressive tax, where lower income groups are taxed at a lower percent rate, and higher income groups are taxed at a higher percent rate. For simplicity, we’re going to assume that a household is taxed at the same rate on all their income.
6) Set progressive tax rates for each income group to bring in enough money. There is no one right answer here – just make sure you bring in enough money!
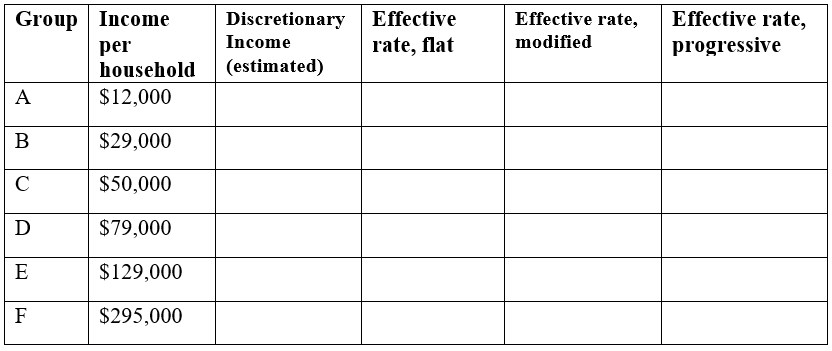
7) Discretionary income is the income people have left over after paying for necessities like rent, food, transportation, etc. The cost of basic expenses does increase with income, since housing and car costs are higher, however usually not proportionally. For each income group, estimate their essential expenses, and calculate their discretionary income. Then compute the effective tax rate for each plan relative to discretionary income rather than income.
8) Which plan seems the most fair to you? Which plan seems the least fair to you? Why?
Project 2: Calculating Taxes.
Visit www.irs.gov, and download the most recent version of forms 1040, and schedules A, B, C, and D.
Scenario 1: Calculate the taxes for someone who earned $60,000 in standard wage income (W-2 income), has no dependents, and takes the standard deduction.
Scenario 2: Calculate the taxes for someone who earned $20,000 in standard wage income, $40,000 in qualified dividends, has no dependents, and takes the standard deduction. (Qualified dividends are earnings on certain investments such as stocks.)
Scenario 3: Calculate the taxes for someone who earned $60,000 in small business income, has no dependents, and takes the standard deduction.
Based on these three scenarios, what are your impressions of how the income tax system treats these different forms of income (wage, dividends, and business income)?
Scenario 4: To get a more realistic sense for calculating taxes, you’ll need to consider itemized deductions. Calculate the income taxes for someone with the income and expenses listed below.
Married with 2 children, filing jointly
Wage income: $50,000 combined
Paid sales tax in Washington State
Property taxes paid: $3200
Home mortgage interest paid: $4800
Charitable gifts: $1200
Adapted from Math in Society by David Lippman, hosted on LibreTexts (math.libretexts.org) and licensed under CC BY-SA 3.0. Changes were made. License: CC-BY-SA-3.0.