Login
📚 Intermediate Algebra 2e
Chapters ▾
⇩ Download ▾

11.4 Hyperbolas

Graph a Hyperbola with Center at (0, 0)

The last conic section we will look at is called a hyperbola. We will see that the equation of a hyperbola looks the same as the equation of an ellipse, except it is a difference rather than a sum. While the equations of an ellipse and a hyperbola are very similar, their graphs are very different.

We define a hyperbola as all points in a plane where the difference of their distances from two fixed points is constant. Each of the fixed points is called a focus of the hyperbola.

The line through the foci, is called the transverse axis. The two points where the transverse axis intersects the hyperbola are each a vertex of the hyperbola. The midpoint of the segment joining the foci is called the center of the hyperbola. The line perpendicular to the transverse axis that passes through the center is called the conjugate axis. Each piece of the graph is called a branch of the hyperbola.
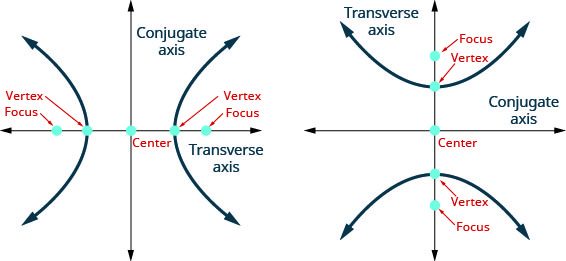
The figure shows two graphs of a hyperbola. The first graph shows the x-axis and y-axis that both run in the negative and positive directions, but at unlabeled intervals. The center of the hyperbola is the origin. The vertices and foci are shown with points that lie on the transverse axis, which is the x-axis. The branches pass through the vertices and open left and right. The y-axis is the conjugate axis. The second graph shows the x-axis and y-axis that both run in the negative and positive directions, but at unlabeled intervals. The center of the hyperbola is the origin. The vertices and foci lie are shown with points that lie on the transverse axis, which is the y-axis. The branches pass through the vertices and open up and down. The x-axis is the conjugate axis.

Again our goal is to connect the geometry of a conic with algebra. Placing the hyperbola on a rectangular coordinate system gives us that opportunity. In the figure, we placed the hyperbola so the foci ((c,0),(c,0)) are on the x-axis and the center is the origin.
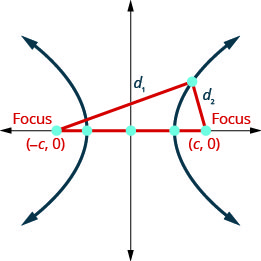
The figure shows the graph of a hyperbola. The graph shows the x-axis and y-axis that both run in the negative and positive directions, but at unlabeled intervals. The center of the hyperbola is the origin. The foci (negative c, 0) and (c, 0) are marked with a point and lie on the x-axis. The vertices are marked with a point and lie on the x-axis. The branches pass through the vertices and open left and right. The distance from (negative c, 0) to a point on the branch (x, y) is marked d sub 1. The distance from (x, y) on the branch to (c, 0) is marked d sub 2.

The definition states the difference of the distance from the foci to a point (x,y) is constant. So |d1d2| is a constant that we will call 2a so |d1d2|=2a. We will use the distance formula to lead us to an algebraic formula for an ellipse.

|d1d2|=2aUse the distance formula to findd1,d2|(x(c))2+(y0)2(xc)2+(y0)2|=2aEliminate the radicals.To simplify the equation of the ellipse, weletc2a2=b2.x2a2+y2c2a2=1So, the equation of a hyperbola centered atthe origin in standard form is:x2a2y2b2=1

To graph the hyperbola, it will be helpful to know about the intercepts. We will find the x-intercepts and y-intercepts using the formula.

x-interceptsy-intercepts x2a2y2b2=1x2a2y2b2=1 Lety=0.x2a202b2=1Letx=0.02a2y2b2=1 x2a2=1y2b2=1 x2=a2y2=b2 x=±ay=±b2 Thex-intercepts are(a,0)and(a,0).There are noy-intercepts.

The a, b values in the equation also help us find the asymptotes of the hyperbola. The asymptotes are intersecting straight lines that the branches of the graph approach but never intersect as the x, y values get larger and larger.

To find the asymptotes, we sketch a rectangle whose sides intersect the x-axis at the vertices (a,0), (a,0) and intersect the y-axis at (0,b), (0,b). The lines containing the diagonals of this rectangle are the asymptotes of the hyperbola. The rectangle and asymptotes are not part of the hyperbola, but they help us graph the hyperbola.
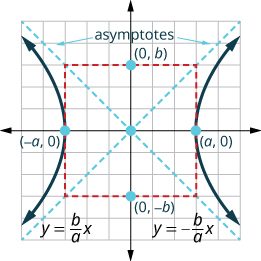
The figure shows the graph of a hyperbola. The graph shows the x-axis and y-axis that both run in the negative and positive directions, but at unlabeled intervals. The center of the hyperbola is the origin. The vertices are (negative a, 0) and (a, 0) and are marked with a point and lie on the x-axis. The points (0, b) and (0, negative) lie on the on the y-axis. There is a central rectangle who sides intersect the x-axis at the vertices (negative a, 0) and (a, 0) and intersect the y-axis at (0, b) and (0, negative b). The asymptotes are given by y is equal to b divided by a times x and y is equal to negative b divided by a times x and are drawn as the diagonals of the central rectangle. The branches of the hyperbola pass through the vertices, open left and right, and approach the asymptotes.

The asymptotes pass through the origin and we can evaluate their slope using the rectangle we sketched. They have equations y=bax and y=bax.

There are two equations for hyperbolas, depending whether the transverse axis is vertical or horizontal. We can tell whether the transverse axis is horizontal by looking at the equation. When the equation is in standard form, if the x2-term is positive, the transverse axis is horizontal. When the equation is in standard form, if the y2-term is positive, the transverse axis is vertical.

The second equations could be derived similarly to what we have done. We will summarize the results here.

Standard Forms of the Equation a Hyperbola with Center (0,0)
x2a2y2b2=1y2a2x2b2=1
OrientationTransverse axis on the x-axis.
Opens left and right
Transverse axis on the y-axis.
Opens up and down
Vertices(a,0), (a,0)(0,a), (0,a)
x-intercepts(a,0), (a,0)none
y-interceptsnone(0,a), (0,a)
RectangleUse (±a,0) (0,±b)Use (0,±a) (±b,0)
asymptotesy=bax, y=baxy=abx, y=abx

We will use these properties to graph hyperbolas.

We summarize the steps for reference.

Sometimes the equation for a hyperbola needs to be first placed in standard form before we graph it.

Graph a Hyperbola with Center at (h,k)

Hyperbolas are not always centered at the origin. When a hyperbola is centered at (h,k) the equations changes a bit as reflected in the table.

Standard Forms of the Equation a Hyperbola with Center (h,k)
(xh)2a2(yk)2b2=1(yk)2a2(xh)2b2=1
OrientationTransverse axis is horizontal.
Opens left and right
Transverse axis is vertical.
Opens up and down
Center(h,k)(h,k)
Verticesa units to the left and right of the centera units above and below the center
RectangleUse a units left/right of center
b units above/ below the center
Use a units above/below the center
b units left/right of center

We summarize the steps for easy reference.

Be careful as you identify the center. The standard equation has xh and yk with the center as (h,k).

Again, sometimes we have to put the equation in standard form as our first step.

Identify Conic Sections by their Equations

Now that we have completed our study of the conic sections, we will take a look at the different equations and recognize some ways to identify a conic by its equation. When we are given an equation to graph, it is helpful to identify the conic so we know what next steps to take.

To identify a conic from its equation, it is easier if we put the variable terms on one side of the equation and the constants on the other.

ConicCharacteristics of x2- and y2- termsExample
ParabolaEither x2 OR y2. Only one variable is squared.x=3y22y+1
Circlex2- and y2- terms have the same coefficientsx2+y2=49
Ellipsex2- and y2- terms have the same sign, different coefficients4x2+25y2=100
Hyperbolax2- and y2- terms have different signs, different coefficients25y24x2=100

Key Concepts

  • Hyperbola: A hyperbola is all points in a plane where the difference of their distances from two fixed points is constant.
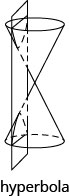
    The figure shows a double napped right circular cone sliced by a plane that is parallel to the vertical axis of the cone forming a hyperbola. The figure is labeled ‘hyperbola’.

    Each of the fixed points is called a focus of the hyperbola.
    The line through the foci, is called the transverse axis.
    The two points where the transverse axis intersects the hyperbola are each a vertex of the hyperbola.
    The midpoint of the segment joining the foci is called the center of the hyperbola.
    The line perpendicular to the transverse axis that passes through the center is called the conjugate axis.
    Each piece of the graph is called a branch of the hyperbola.
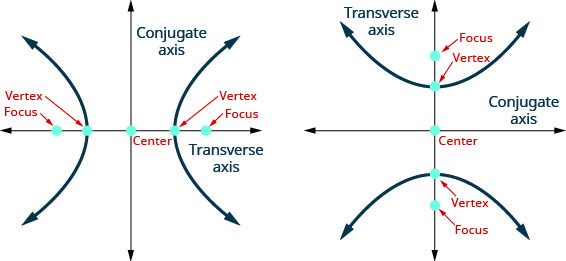
    The figure shows two graphs of a hyperbola. The first graph shows the x-axis and y-axis that both run in the negative and positive directions, but at unlabeled intervals. The center of the hyperbola is the origin. The vertices and foci are shown with points that lie on the transverse axis, which is the x-axis. The branches pass through the vertices and open left and right. The y-axis is the conjugate axis. The second graph shows the x-axis and y-axis that both run in the negative and positive directions, but at unlabeled intervals. The center of the hyperbola is the origin. The vertices and foci lie are shown with points that lie on the transverse axis, which is the y-axis. The branches pass through the vertices and open up and down. The x-axis is the conjugate axis.

    Standard Forms of the Equation a Hyperbola with Center (0,0)
    x2a2y2b2=1y2a2x2b2=1
    OrientationTransverse axis on the x-axis.
    Opens left and right
    Transverse axis on the y-axis.
    Opens up and down
    Vertices(a,0), (a,0)(0,a), (0,a)
    x-intercepts(a,0), (a,0)none
    y-interceptsnone(0,a), (0,a)
    RectangleUse (±a,0) (0,±b)Use (0,±a) (±b,0)
    asymptotesy=bax, y=baxy=abx, y=abx
  • How to graph a hyperbola centered at (0,0).
    1. Write the equation in standard form.
    2. Determine whether the transverse axis is horizontal or vertical.
    3. Find the vertices.
    4. Sketch the rectangle centered at the origin intersecting one axis at ±a and the other at ±b.
    5. Sketch the asymptotes—the lines through the diagonals of the rectangle.
    6. Draw the two branches of the hyperbola.

    Standard Forms of the Equation a Hyperbola with Center (h,k)
    (xh)2a2(yk)2b2=1(yk)2a2(xh)2b2=1
    OrientationTransverse axis is horizontal.
    Opens left and right
    Transverse axis is vertical.
    Opens up and down
    Center(h,k)(h,k)
    Verticesa units to the left and right of the centera units above and below the center
    RectangleUse a units left/right of center
    b units above/below the center
    Use a units above/below the center
    b units left/right of center
  • How to graph a hyperbola centered at (h,k).
    1. Write the equation in standard form.
    2. Determine whether the transverse axis is horizontal or vertical.
    3. Find the center and a,b.
    4. Sketch the rectangle centered at (h,k) using a,b.
    5. Sketch the asymptotes—the lines through the diagonals of the rectangle. Mark the vertices.
    6. Draw the two branches of the hyperbola.

    ConicCharacteristics of x2- and y2- termsExample
    ParabolaEither x2 OR y2. Only one variable is squared.x=3y22y+1
    Circlex2- and y2- terms must have the same coefficients and they must be the same sign as the constant after the = signx2+y2=49
    Ellipsex2- and y2- terms have the same sign, different coefficients4x2+25y2=100
    Hyperbolax2- and y2- terms have different signs25y24x2=100

Practice Makes Perfect

Graph a Hyperbola with Center at (0,0)

In the following exercises, graph.
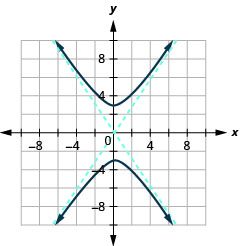
x29y24=1

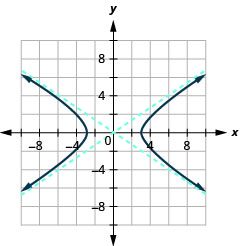
The graph shows the x-axis and y-axis that both run in the negative and positive directions, but at unlabeled intervals, with asymptotes y is equal to plus or minus two-thirds times x, and branches that pass through the vertices (plus or minus 3, 0) and open left and right.

x225y29=1

x216y225=1

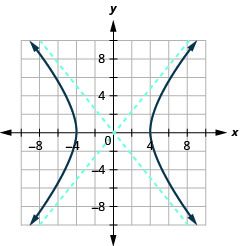
The graph shows the x-axis and y-axis that both run in the negative and positive directions with asymptotes y is equal to plus or minus five-fourths times x, and branches that pass through the vertices (plus or minus 4, 0) and open left and right.

x29y236=1

y225x24=1

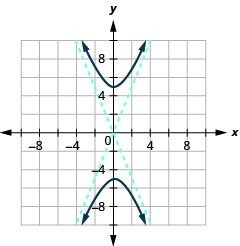
The graph shows the x-axis and y-axis that both run in the negative and positive directions with asymptotes y is equal to plus or minus five-halves times x, and branches that pass through the vertices (0, plus or minus 5) and open up and down.

y236x216=1

16y29x2=144

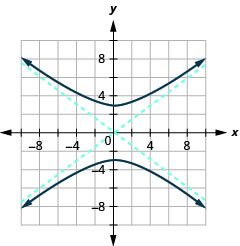
The graph shows the x-axis and y-axis that both run in the negative and positive directions with asymptotes y is equal to plus or minus three-fourths times x, and branches that pass through the vertices (0, plus or minus 3) and open up and down.

25y29x2=225

4y29x2=36

The graph shows the x-axis and y-axis that both run in the negative and positive directions with asymptotes y is equal to plus or minus three-halves times x, and branches that pass through the vertices (0, plus or minus 3) and open up and down.

16y225x2=400

4x216y2=64

The graph shows the x-axis and y-axis that both run in the negative and positive directions with asymptotes y is equal to plus or minus one-half times x, and branches that pass through the vertices (plus or minus 4, 0) and open left and right.

9x24y2=36

Graph a Hyperbola with Center at (h,k)

In the following exercises, graph.
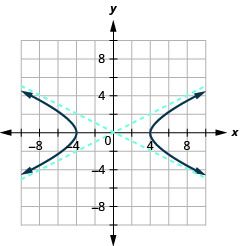
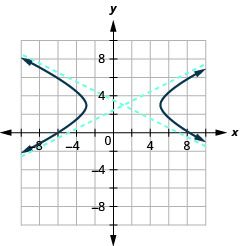
(x1)216(y3)24=1

The graph shows the x-axis and y-axis that both run in the negative and positive directions with the center (1, 3) an asymptote that passes through (negative 3, 1) and (5, 5) and an asymptote that passes through (5, 1) and (negative 3, 5), and branches that pass through the vertices (negative 3, 3) and (5, 3) and opens left and right.

(x2)24(y3)216=1

(y4)29(x2)225=1

The graph shows the x-axis and y-axis that both run in the negative and positive directions with the center (1, 3) an asymptote that passes through (negative 3, 1) and (5, 5) and an asymptote that passes through (5, 1) and (negative 3, 5), and branches that pass through the vertices (negative 3, 3) and (5, 3) and opens left and right.

(y1)225(x4)216=1

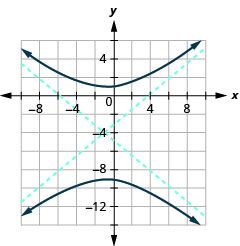
(y+4)225(x+1)236=1

The graph shows the x-axis and y-axis that both run in the negative and positive directions with the center (1, negative 4) an asymptote that passes through (negative 7, 1) and (5, negative 9) and an asymptote that passes through (5, 1) and (negative 7, negative 9), and branches that pass through the vertices (1, 1) and (1, negative 9) and open up and down.

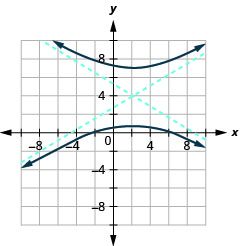
(y+1)216(x+1)24=1

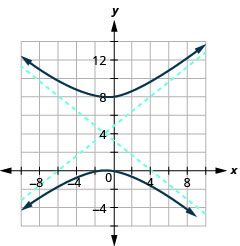
(y4)216(x+1)225=1

The graph shows the x-axis and y-axis that both run in the negative and positive directions with the center (negative 1, 4) an asymptote that passes through (4, 8) and (negative 6, 0) and an asymptote that passes through (negative 6, 8) and (4, 0), and branches that pass through the vertices (negative 1, 0) and (negative 1, 8) and open up and down.

(y+3)216(x3)236=1

(x3)225(y+2)29=1

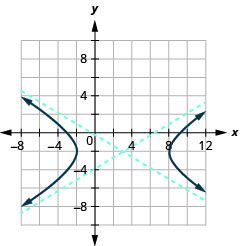
The graph shows the x-axis and y-axis that both run in the negative and positive directions with the center (3, negative 2) an asymptote that passes through (8, 1) and (negative 2, negative 5) and an asymptote that passes through (negative 2, negative 1) and (8, negative 5), and branches that pass through the vertices (negative 2, negative 2) and (8, negative 2) and opens left and right.

(x+2)24(y1)29=1

In the following exercises, ⓐ write the equation in standard form and ⓑ graph.

9x24y218x+8y31=0

(x1)24(y1)29=1

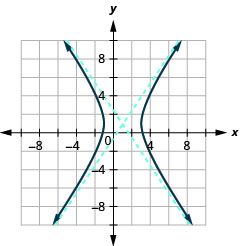
The graph shows the x-axis and y-axis that both run in the negative and positive directions with the center (1, 1) an asymptote that passes through (3, 4) and (negative 1, negative 2) and an asymptote that passes through (negative 1, 4) and (3, negative 2), and branches that pass through the vertices (negative 1, 1) and (3, 1) and opens left and right.

16x24y2+64x24y36=0

y2x24y+2x6=0

(y2)29(x1)29=1

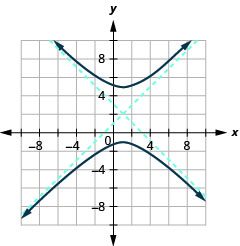
The graph shows the x-axis and y-axis that both run in the negative and positive directions with the center (1, 2) an asymptote that passes through (4, 5) and (negative 2, negative 1) and an asymptote that passes through (negative 2, 5) and (4, negative 1), and branches that pass through the vertices (1, 5) and (1, negative 1) and open up and down.

4y216x224y+96x172=0

9y2x2+18y4x4=0

(y+1)21(x+2)29=1

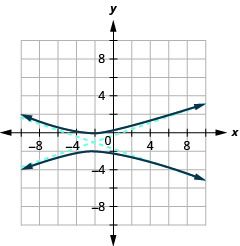
The graph shows the x-axis and y-axis that both run in the negative and positive directions with the center (negative 2, negative 1) an asymptote that passes through (1, 0) and (negative 5, negative 2) and an asymptote that passes through (3, 0) and (1, negative 2), and branches that pass through the vertices (negative 2, 0) and (negative 2, negative 2) and open up and down.

Identify the Graph of each Equation as a Circle, Parabola, Ellipse, or Hyperbola

In the following exercises, identify the type of graph.

x=y22y+39y2x2+18y4x4=09x2+25y2=225x2+y24x+10y7=0

x=−2y212y16x2+y2=916x24y2+64x24y36=016x2+36y2=576

ⓐ parabola ⓑ circle ⓒ hyperbola ⓓ ellipse

Mixed Practice

In the following exercises, graph each equation.
(y3)29(x+2)216=1

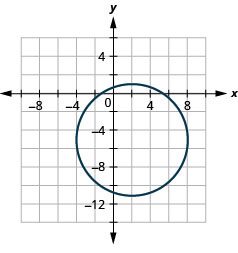
x2+y24x+10y7=0

The graph shows the x y coordinate plane with a circle whose center is (2, negative 5) and whose radius is 6 units.

y=(x1)2+2

x29+y225=1

The graph shows the x y coordinate plane with an ellipse whose major axis is vertical, vertices are (0, plus or minus 5) and co-vertices are (plus or minus 3, 0).

(x+2)2+(y5)2=4

y2x24y+2x6=0

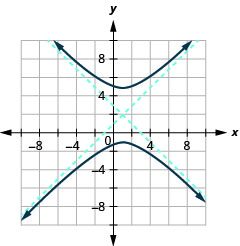
The graph shows the x y coordinate plane with the center (1, 2) an asymptote that passes through (negative 2, 5) and (5, negative 1) and an asymptote that passes through (4, 5) and (2, 0), and branches that pass through the vertices (1, 5) and (negative 2, negative 1) and open up and down.

x=y22y+3

16x2+9y2=144

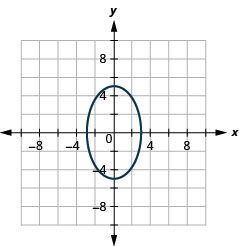
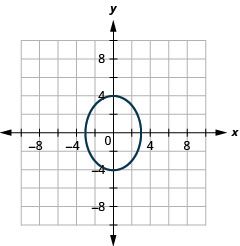
The graph shows the x y coordinate plane with an ellipse whose major axis is vertical, vertices are (0, plus or minus 4) and co-vertices are (plus or minus 3, 0).

Writing Exercises

In your own words, define a hyperbola and write the equation of a hyperbola centered at the origin in standard form. Draw a sketch of the hyperbola labeling the center, vertices, and asymptotes.

Explain in your own words how to create and use the rectangle that helps graph a hyperbola.

Answers will vary.

Compare and contrast the graphs of the equations x24y29=1 and y29x24=1.

Explain in your own words, how to distinguish the equation of an ellipse with the equation of a hyperbola.

Answers will vary.

Self Check

ⓐ After completing the exercises, use this checklist to evaluate your mastery of the objectives of this section.
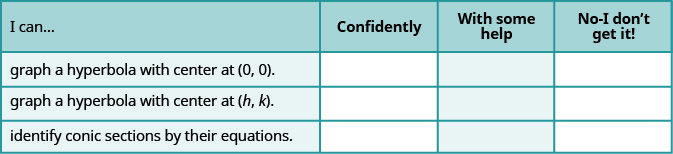
This table has four columns and four rows. The first row is a header and it labels each column, “I can…”, “Confidently,” “With some help,” and “No-I don’t get it!” In row 2, the I can was graph a hyperbola with center at (0, 0). In row 3, the I can was graph a hyperbola with a center at (h, k). In row 4, the I can was identify conic sections by their equations.

ⓑ On a scale of 1-10, how would you rate your mastery of this section in light of your responses on the checklist? How can you improve this?