Login
📚 Intermediate Algebra 2e
Chapters ▾
⇩ Download ▾

9.7 Graph Quadratic Functions Using Transformations

Graph Quadratic Functions of the form f(x)=x2+k

In the last section, we learned how to graph quadratic functions using their properties. Another method involves starting with the basic graph of f(x)=x2 and ‘moving’ it according to information given in the function equation. We call this graphing quadratic functions using transformations.

In the first example, we will graph the quadratic function f(x)=x2 by plotting points. Then we will see what effect adding a constant, k, to the equation will have on the graph of the new function f(x)=x2+k.

The last example shows us that to graph a quadratic function of the form f(x)=x2+k, we take the basic parabola graph of f(x)=x2 and vertically shift it up (k>0) or shift it down (k<0).

This transformation is called a vertical shift.

Now that we have seen the effect of the constant, k, it is easy to graph functions of the form f(x)=x2+k. We just start with the basic parabola of f(x)=x2 and then shift it up or down.

It may be helpful to practice sketching f(x)=x2 quickly. We know the values and can sketch the graph from there.
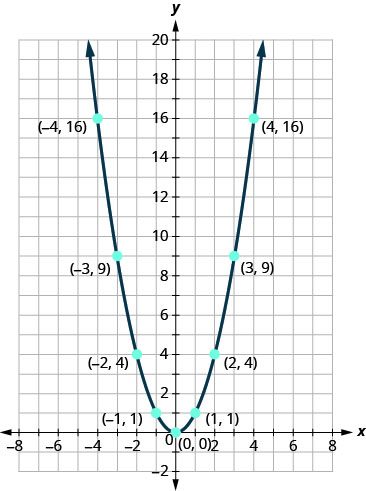
This figure shows an upward-opening parabola on the x y-coordinate plane, with vertex (0, 0). Other points on the curve are located at (negative 4, 16), (negative 3, 9), (negative 2, 4), (negative 1, 1), (1, 1), (2, 4), (3, 9), and (4, 16).

Once we know this parabola, it will be easy to apply the transformations. The next example will require a vertical shift.

Graph Quadratic Functions of the form f(x)=(xh)2

In the first example, we graphed the quadratic function f(x)=x2 by plotting points and then saw the effect of adding a constant k to the function had on the resulting graph of the new function f(x)=x2+k.

We will now explore the effect of subtracting a constant, h, from x has on the resulting graph of the new function f(x)=(xh)2.

The last example shows us that to graph a quadratic function of the form f(x)=(xh)2, we take the basic parabola graph of f(x)=x2 and shift it left (h > 0) or shift it right (h < 0).

This transformation is called a horizontal shift.

Now that we have seen the effect of the constant, h, it is easy to graph functions of the form f(x)=(xh)2. We just start with the basic parabola of f(x)=x2 and then shift it left or right.

The next example will require a horizontal shift.

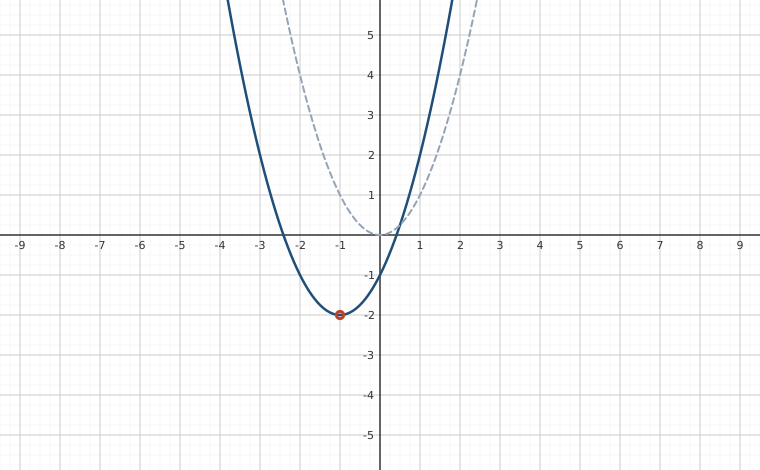
Now that we know the effect of the constants h and k, we will graph a quadratic function of the form f(x)=(xh)2+k by first drawing the basic parabola and then making a horizontal shift followed by a vertical shift. We could do the vertical shift followed by the horizontal shift, but most students prefer the horizontal shift followed by the vertical.
Graph Quadratic Functions of the Form f(x)=ax2

So far we graphed the quadratic function f(x)=x2 and then saw the effect of including a constant h or k in the equation had on the resulting graph of the new function. We will now explore the effect of the coefficient a on the resulting graph of the new function f(x)=ax2.
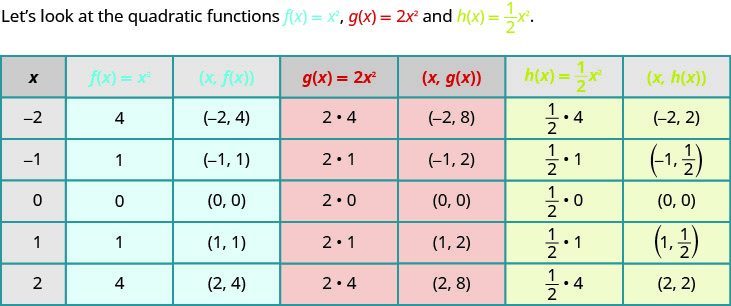
A table depicting the effect of constants on the basic function of x squared. The table has seven columns labeled x, f of x equals x squared, the ordered pair (x, f of x), g of x equals 2 times x squared, the ordered pair (x, g of x), h of x equals one-half times x squared, and the ordered pair (x, h of x). In the x column, the values given are negative 2, negative 1, 0, 1, and 2. In the f of x equals x squared column, the values are 4, 1, 0, 1, and 4. In the (x, f of x) column, the ordered pairs (negative 2, 4), (negative 1, 1), (0, 0), (1, 1), and (2, 4) are given. The g of x equals 2 times x squared column contains the expressions 2 times 4, 2 times 1, 2 times 0, 2 times 1, and 2 times 4. The (x, g of x) column has the ordered pairs of (negative 2, 8), (negative 1, 2), (0, 0), (1, 2), and (2,8). In the h of x equals one-half times x squared, the expressions given are one-half times 4, one-half times 1, one-half times 0, one-half times 1, and one-half times 4. In last column, (x, h of x), contains the ordered pairs (negative 2, 2), (negative 1, one-half), (0, 0), (1, one-half), and (2, 2).

If we graph these functions, we can see the effect of the constant a, assuming a > 0.
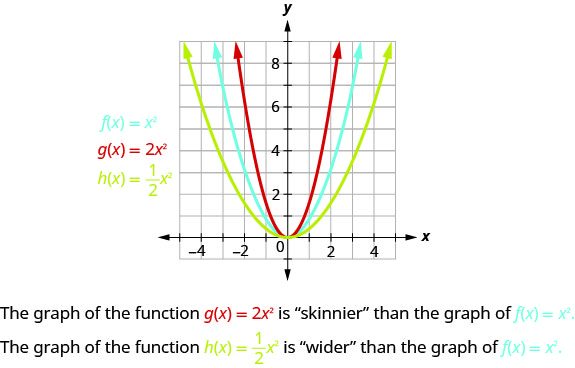
This figure shows 3 upward-opening parabolas on the x y-coordinate plane. One is the graph of f of x equals x squared and has a vertex of (0, 0). Other points on the curve are located at (negative 1, 1) and (1, 1). The slimmer curve of g of x equals 2 times x square has a vertex at (0,0) and other points of (negative 1, one-half) and (1, one-half). The wider curve, h of x equals one-half x squared, has a vertex at (0,0) and other points of (negative 2, 2) and (2,2).

To graph a function with constant a it is easiest to choose a few points on f(x)=x2 and multiply the y-values by a.

Graph Quadratic Functions Using Transformations

We have learned how the constants a, h, and k in the functions, f(x)=x2+k,f(x)=(xh)2, and f(x)=ax2 affect their graphs. We can now put this together and graph quadratic functions f(x)=ax2+bx+c by first putting them into the form f(x)=a(xh)2+k by completing the square. This form is sometimes known as the vertex form or standard form.

We must be careful to both add and subtract the number to the SAME side of the function to complete the square. We cannot add the number to both sides as we did when we completed the square with quadratic equations.
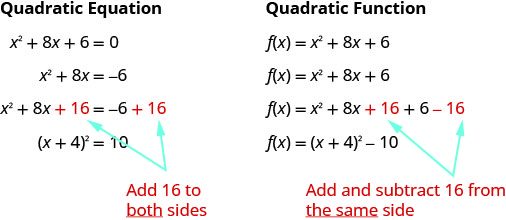
This figure shows the difference when completing the square with a quadratic equation and a quadratic function. For the quadratic equation, start with x squared plus 8 times x plus 6 equals zero. Subtract 6 from both sides to get x squared plus 8 times x equals negative 6 while leaving space to complete the square. Then, complete the square by adding 16 to both sides to get x squared plush 8 times x plush 16 equals negative 6 plush 16. Factor to get the quantity x plus 4 squared equals 10. For the quadratic function, start with f of x equals x squared plus 8 times x plus 6. The second line shows to leave space between the 8 times x and the 6 in order to complete the square. Complete the square by adding 16 and subtracting 16 on the same side to get f of x equals x squared plus 8 times x plush 16 plus 6 minus 16. Factor to get f of x equals the quantity of x plush 4 squared minus 10.

When we complete the square in a function with a coefficient of x2 that is not one, we have to factor that coefficient from just the x-terms. We do not factor it from the constant term. It is often helpful to move the constant term a bit to the right to make it easier to focus only on the x-terms.

Once we get the constant we want to complete the square, we must remember to multiply it by that coefficient before we then subtract it.

Once we put the function into the f(x)=(xh)2+k form, we can then use the transformations as we did in the last few problems. The next example will show us how to do this.

We list the steps to take to graph a quadratic function using transformations here.

Now that we have completed the square to put a quadratic function into f(x)=a(xh)2+k form, we can also use this technique to graph the function using its properties as in the previous section.

If we look back at the last few examples, we see that the vertex is related to the constants h and k.
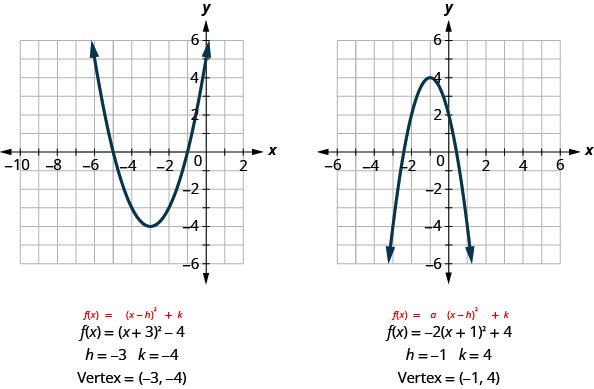
The first graph shows an upward-opening parabola on the x y-coordinate plane with a vertex of (negative 3, negative 4) with other points of (0, negative 5) and (0, negative 1). Underneath the graph, it shows the standard form of a parabola, f of x equals the quantity x minus h squared plus k, with the equation of the parabola f of x equals the quantity of x plus 3 squared minus 4 where h equals negative 3 and k equals negative 4. The second graph shows a downward-opening parabola on the x y-coordinate plane with a vertex of (negative 1, 4) and other points of (0,2) and (negative 2,2). Underneath the graph, it shows the standard form of a parabola, f of x equals a times the quantity x minus h squared plus k, with the equation of the parabola f of x equals negative 2 times the quantity of x plus 1 squared plus 4 where h equals negative 1 and k equals 4.

In each case, the vertex is (h, k). Also the axis of symmetry is the line x = h.

We rewrite our steps for graphing a quadratic function using properties for when the function is in f(x)=a(xh)2+k form.

Find a Quadratic Function from its Graph

So far we have started with a function and then found its graph.

Now we are going to reverse the process. Starting with the graph, we will find the function.

Key Concepts

  • Graph a Quadratic Function of the form f(x)=x2+k Using a Vertical Shift
    • The graph of f(x)=x2+k shifts the graph of f(x)=x2 vertically k units.
      • If k > 0, shift the parabola vertically up k units.
      • If k < 0, shift the parabola vertically down |k| units.
  • Graph a Quadratic Function of the form f(x)=(xh)2 Using a Horizontal Shift
    • The graph of f(x)=(xh)2 shifts the graph of f(x)=x2 horizontally h units.
      • If h > 0, shift the parabola horizontally left h units.
      • If h < 0, shift the parabola horizontally right |h| units.
  • Graph of a Quadratic Function of the form f(x)=ax2
    • The coefficient a in the function f(x)=ax2 affects the graph of f(x)=x2 by stretching or compressing it.
      If 0<|a|<1, then the graph of f(x)=ax2 will be “wider” than the graph of f(x)=x2.
      If |a|>1, then the graph of f(x)=ax2 will be “skinnier” than the graph of f(x)=x2.
  • How to graph a quadratic function using transformations
    1. Rewrite the function in f(x)=a(xh)2+k form by completing the square.
    2. Graph the function using transformations.
  • Graph a quadratic function in the vertex form f(x)=a(xh)2+k using properties
    1. Rewrite the function in f(x)=a(xh)2+k form.
    2. Determine whether the parabola opens upward, a > 0, or downward, a < 0.
    3. Find the axis of symmetry, x = h.
    4. Find the vertex, (h, k).
    5. Find they-intercept. Find the point symmetric to the y-intercept across the axis of symmetry.
    6. Find the x-intercepts, if possible.
    7. Graph the parabola.

Practice Makes Perfect

Graph Quadratic Functions of the form f(x)=x2+k

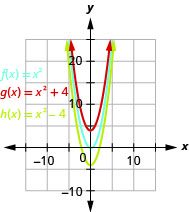
In the following exercises, ⓐ graph the quadratic functions on the same rectangular coordinate system and ⓑ describe what effect adding a constant, k, to the function has on the basic parabola.

f(x)=x2,g(x)=x2+4, and h(x)=x24.


This figure shows 3 upward-opening parabolas on the x y-coordinate plane. The middle curve is the graph of f of x equals x squared and has a vertex of (0, 0). Other points on the curve are located at (negative 1, 1) and (1, 1). The top curve has been moved up 4 units, and the bottom has been moved down 4 units.

ⓑ The graph of g(x)=x2+4 is the same as the graph of f(x)=x2 but shifted up 4 units. The graph of h(x)=x24 is the same as the graph of f(x)=x2 but shift down 4 units.

f(x)=x2,g(x)=x2+7, and h(x)=x27.

In the following exercises, graph each function using a vertical shift.
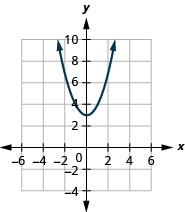
f(x)=x2+3

This figure shows an upward-opening parabolas on the x y-coordinate plane. It has a vertex of (0, 3) and other points (7, 2) and (7, negative 2).

f(x)=x27

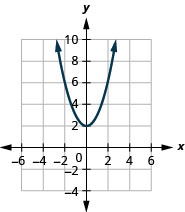
g(x)=x2+2

This figure shows an upward-opening parabolas on the x y-coordinate plane. It has a vertex of (0, 2) and other points (negative 2, 6) and (2, 6).

g(x)=x2+5

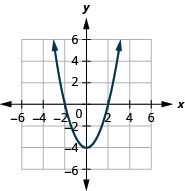
h(x)=x24

This figure shows an upward-opening parabolas on the x y-coordinate plane. It has a vertex of (0, negative 4) and other points (negative 2, 0) and (2, 0).

h(x)=x25

Graph Quadratic Functions of the form f(x)=(xh)2

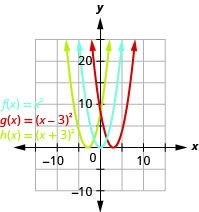
In the following exercises, ⓐ graph the quadratic functions on the same rectangular coordinate system and ⓑ describe what effect adding a constant, h, inside the parentheses has

f(x)=x2,g(x)=(x3)2, and h(x)=(x+3)2.


This figure shows 3 upward-opening parabolas on the x y-coordinate plane. One is the graph of f of x equals x squared and has a vertex of (0, 0). Other points on the curve are located at (negative 1, 1) and (1, 1). The graph to the right is shifted 3 units to the right to produce g of x equals the quantity of x minus 3 squared. The graph the left is shifted 3 units to the left to produce h of x equals the quantity of x plus 3 squared.

ⓑ The graph of g(x)=(x3)2 is the same as the graph of f(x)=x2 but shifted right 3 units. The graph of h(x)=(x+3)2 is the same as the graph of f(x)=x2 but shifted left 3 units.

f(x)=x2,g(x)=(x+4)2, and h(x)=(x4)2.

In the following exercises, graph each function using a horizontal shift.
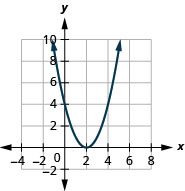
f(x)=(x2)2

This figure shows an upward-opening parabolas on the x y-coordinate plane. It has a vertex of (2, 0) and other points (0, 4) and (4, 4).

f(x)=(x1)2

f(x)=(x+5)2

This figure shows an upward-opening parabolas on the x y-coordinate plane. It has a vertex of (negative 5, 0) and other points (negative 7, 4) and (negative 3, 4).

f(x)=(x+3)2

f(x)=(x5)2

This figure shows an upward-opening parabolas on the x y-coordinate plane. It has a vertex of (5, 0) and other points (3, 4) and (7, 4).

f(x)=(x+2)2

In the following exercises, graph each function using transformations.
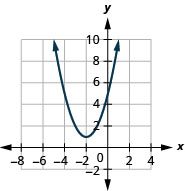
f(x)=(x+2)2+1

This figure shows an upward-opening parabolas on the x y-coordinate plane. It has a vertex of (negative 2, 1) and other points (negative 4, 5) and (0, 5).

f(x)=(x+4)2+2

f(x)=(x1)2+5

This figure shows an upward-opening parabolas on the x y-coordinate plane. It has a vertex of (1, 5) and other points (negative 1, 9) and (3, 9).

f(x)=(x3)2+4

f(x)=(x+3)21

This figure shows an upward-opening parabolas on the x y-coordinate plane. It has a vertex of (negative 3, 1) and other points (negative 4, 0) and (negative 2, 0).

f(x)=(x+5)22

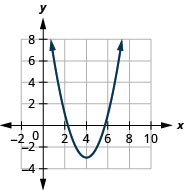
f(x)=(x4)23

This figure shows an upward-opening parabolas on the x y-coordinate plane. It has a vertex of (4, negative 2) and other points (3, negative 2) and (5, negative 2).

f(x)=(x6)22

Graph Quadratic Functions of the form f(x)=ax2

In the following exercises, graph each function.
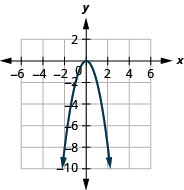
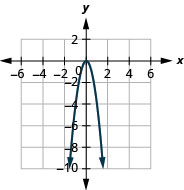
f(x)=−2x2

This figure shows a downward-opening parabolas on the x y-coordinate plane. It has a vertex of (0, 0) and other points (negative 1, negative 2) and (1, negative 2).

f(x)=4x2

f(x)=−4x2

This figure shows a downward-opening parabolas on the x y-coordinate plane. It has a vertex of (0, 0) and other points (negative 1, negative 4) and (1, negative 4).

f(x)=x2

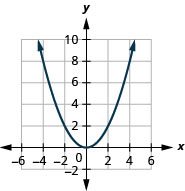
f(x)=12x2

This figure shows an upward-opening parabolas on the x y-coordinate plane. It has a vertex of (0, 0) and other points (negative 2, 2) and (2, 2).

f(x)=13x2

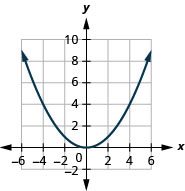
f(x)=14x2

This figure shows an upward-opening parabolas on the x y-coordinate plane. It has a vertex of (0, 0) and other points (2, 1) and (negative 2, 1).

f(x)=12x2

Graph Quadratic Functions Using Transformations

In the following exercises, rewrite each function in the f(x)=a(xh)2+k form by completing the square.

f(x)=−3x212x5

f(x)=−3(x+2)2+7

f(x)=2x212x+7

f(x)=3x2+6x1

f(x)=3(x+1)24

f(x)=−4x216x9

In the following exercises, ⓐ rewrite each function in f(x)=a(xh)2+k form and ⓑ graph it by using transformations.

f(x)=x2+6x+5

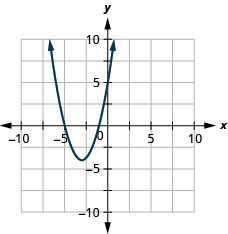
f(x)=(x+3)24

This figure shows an upward-opening parabolas on the x y-coordinate plane. It has a vertex of (negative 3, 3), y-intercept of (0, 5), and axis of symmetry shown at x equals negative 3.

f(x)=x2+4x12

f(x)=x2+4x+3

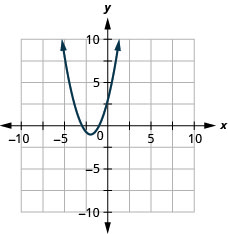
f(x)=(x+2)21

This figure shows an upward-opening parabolas on the x y-coordinate plane. It has a vertex of (negative 2, negative 1), y-intercept of (0, 3), and axis of symmetry shown at x equals negative 2.

f(x)=x26x+8

f(x)=x26x+15

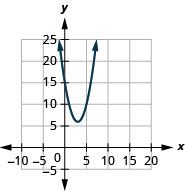
f(x)=(x3)2+6

This figure shows an upward-opening parabolas on the x y-coordinate plane. It has a vertex of (3, 6), y-intercept of (0, 10), and axis of symmetry shown at x equals 3.

f(x)=x2+8x+10

f(x)=x2+8x16

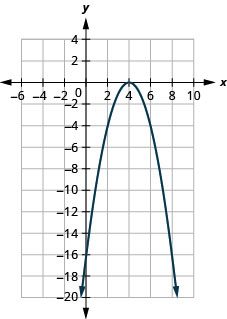
f(x)=(x4)2+0

This figure shows a downward-opening parabola on the x y-coordinate plane. It has a vertex of (4, 0), y-intercept of (0, negative 16), and axis of symmetry shown at x equals 4.

f(x)=x2+2x7

f(x)=x24x+2

f(x)=(x+2)2+6

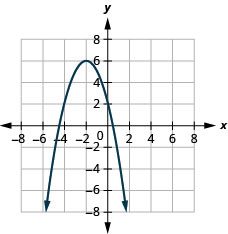
This figure shows a downward-opening parabola on the x y-coordinate plane. It has a vertex of (negative 2, 6), y-intercept of (0, 2), and axis of symmetry shown at x equals negative 2.

f(x)=x2+4x5

f(x)=5x210x+8

f(x)=5(x1)2+3

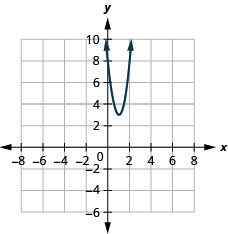
This figure shows an upward-opening parabola on the x y-coordinate plane. It has a vertex of (1, 3), y-intercept of (0, 8), and axis of symmetry shown at x equals 1.

f(x)=3x2+18x+20

f(x)=2x24x+1

f(x)=2(x1)21

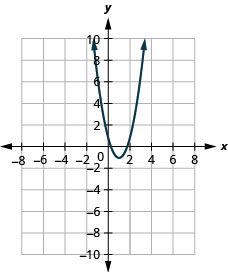
This figure shows an upward-opening parabola on the x y-coordinate plane. It has a vertex of (1, negative 1), y-intercept of (0, 1), and axis of symmetry shown at x equals 1.

f(x)=3x26x1

f(x)=−2x2+8x10

f(x)=−2(x2)22

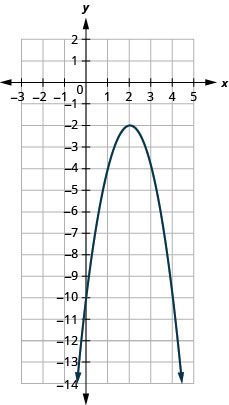
This figure shows a downward-opening parabola on the x y-coordinate plane. It has a vertex of (2, negative 2), y-intercept of (0, negative 10), and axis of symmetry shown at x equals 2.

f(x)=−3x2+6x+1

In the following exercises, ⓐ rewrite each function in f(x)=a(xh)2+k form and ⓑ graph it using properties.

f(x)=2x2+4x+6

f(x)=2(x+1)2+4

This figure shows an upward-opening parabola on the x y-coordinate plane. It has a vertex of (negative 1, 4), y-intercept of (0, 6), and axis of symmetry shown at x equals negative 1.

f(x)=3x212x+7

f(x)=x2+2x4

f(x)=(x1)23

This figure shows a downward-opening parabola on the x y-coordinate plane. It has a vertex of (1, negative 3), y-intercept of (0, negative 4), and axis of symmetry shown at x equals 1.

f(x)=−2x24x5

Matching

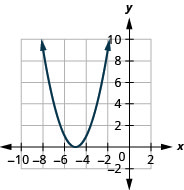
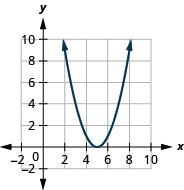
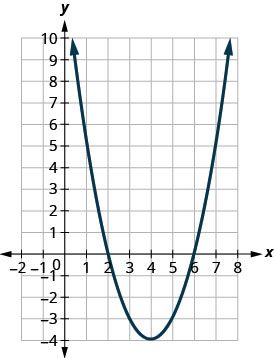
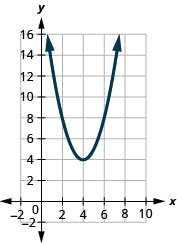
In the following exercises, match the graphs to one of the following functions: ⓐ f(x)=x2+4f(x)=x24f(x)=(x+4)2f(x)=(x4)2f(x)=(x+4)24f(x)=(x+4)2+4f(x)=(x4)24f(x)=(x4)2+4

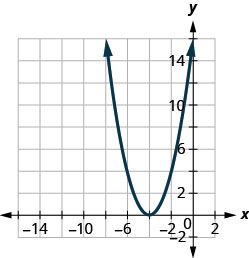
This figure shows an upward-opening parabola on the x y-coordinate plane. It has a vertex of (negative 4, 0) and other points (negative 4, 4) and (negative 2, 4).

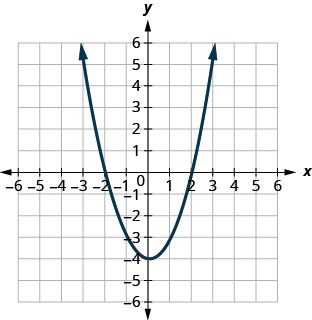
This figure shows an upward-opening parabola on the x y-coordinate plane. It has a vertex of (0, negative 4) and other points (negative 2, 0) and (2, 0).
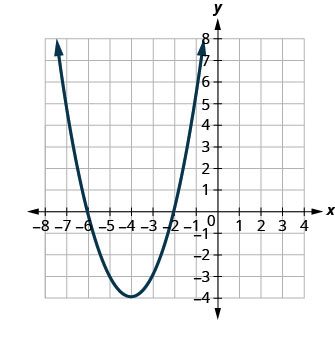
This figure shows an upward-opening parabola on the x y-coordinate plane. It has a vertex of (negative 4, negative 4) and other points (negative 4, 0) and (negative 2, 0).

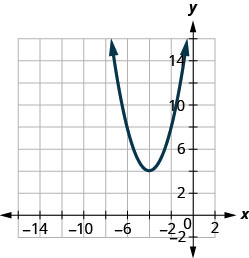
This figure shows an upward-opening parabola on the x y-coordinate plane. It has a vertex of (negative 4, 4) and other points (negative 6, 8) and (negative 2, 8).
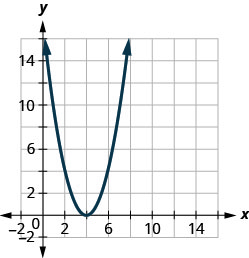
This figure shows an upward-opening parabola on the x y-coordinate plane. It has a vertex of (4, 0) and other points (2, 4) and (2, 4).

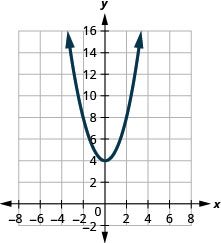
This figure shows an upward-opening parabola on the x y-coordinate plane. It has a vertex of (0, 4) and other points (negative 2, 8) and (2, 8).
This figure shows an upward-opening parabola on the x y-coordinate plane. It has a vertex of (4, negative 4) and other points (2,0) and (6,0).

This figure shows an upward-opening parabola on the x y-coordinate plane. It has a vertex of (4, 4) and other points (2,8) and (6,8).

Find a Quadratic Function from its Graph

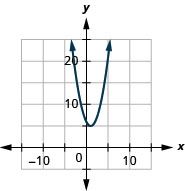
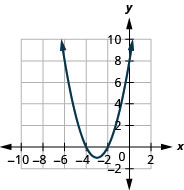
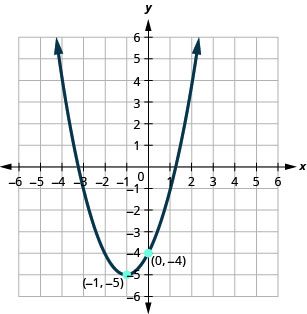
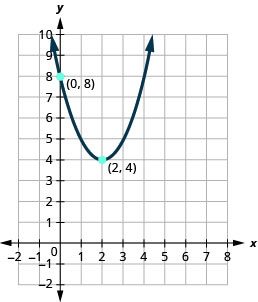
In the following exercises, write the quadratic function in f(x)=a(xh)2+k form whose graph is shown.

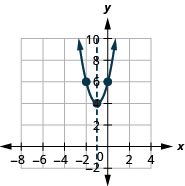
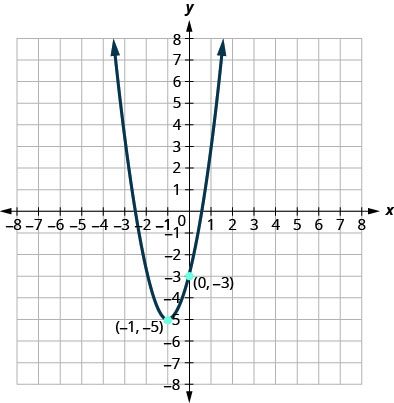
This figure shows an upward-opening parabola on the x y-coordinate plane. It has a vertex of (negative 1, negative 5) and y-intercept (0, negative 4).

f(x)=(x+1)25

This figure shows an upward-opening parabola on the x y-coordinate plane. It has a vertex of (2,4) and y-intercept (0, 8).
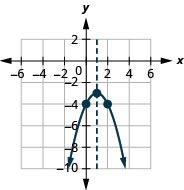
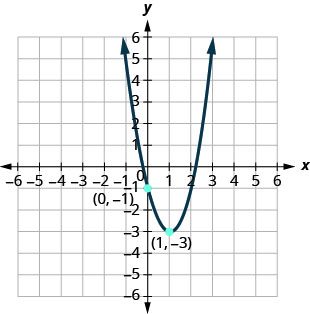
This figure shows an upward-opening parabola on the x y-coordinate plane. It has a vertex of (1, negative 3) and y-intercept (0, negative 1).

f(x)=2(x1)23

This figure shows an upward-opening parabola on the x y-coordinate plane. It has a vertex of (negative 1, negative 5) and y-intercept (0, negative 3).

Writing Exercise

Graph the quadratic function f(x)=x2+4x+5 first using the properties as we did in the last section and then graph it using transformations. Which method do you prefer? Why?

Answers will vary.

Graph the quadratic function f(x)=2x24x3 first using the properties as we did in the last section and then graph it using transformations. Which method do you prefer? Why?

Self Check

ⓐ After completing the exercises, use this checklist to evaluate your mastery of the objectives of this section.
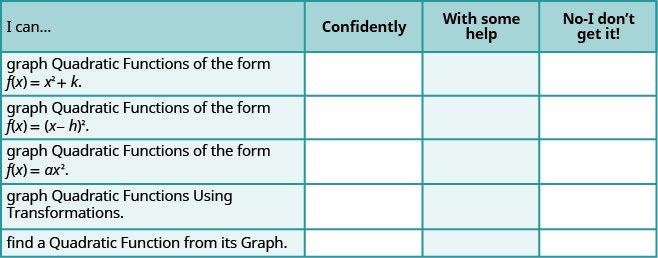
This figure is a list to assess your understanding of the concepts presented in this section. It has 4 columns labeled I can…, Confidently, With some help, and No-I don’t get it! Below I can…, there is graph Quadratic Functions of the form f of x equals x squared plus k; graph Quadratic Functions of the form f of x equals the quantity x minus h squared; graph Quadratic functions of the form f of x equals a times x squared; graph Quadratic Functions Using Transformations; find a Quadratic Function from its Graph. The other columns are left blank for you to check you understanding.

ⓑ After looking at the checklist, do you think you are well-prepared for the next section? Why or why not?