Login
📚 Intermediate Algebra 2e
Chapters ▾
⇩ Download ▾

3.5 Relations and Functions

Find the Domain and Range of a Relation

As we go about our daily lives, we have many data items or quantities that are paired to our names. Our social security number, student ID number, email address, phone number and our birthday are matched to our name. There is a relationship between our name and each of those items.

When your professor gets her class roster, the names of all the students in the class are listed in one column and then the student ID number is likely to be in the next column. If we think of the correspondence as a set of ordered pairs, where the first element is a student name and the second element is that student’s ID number, we call this a relation.

(Student name, Student ID #)

The set of all the names of the students in the class is called the domain of the relation and the set of all student ID numbers paired with these students is the range of the relation.

There are many similar situations where one variable is paired or matched with another. The set of ordered pairs that records this matching is a relation.

A graph is yet another way that a relation can be represented. The set of ordered pairs of all the points plotted is the relation. The set of all x-coordinates is the domain of the relation and the set of all y-coordinates is the range. Generally we write the numbers in ascending order for both the domain and range.

Determine if a Relation is a Function

A special type of relation, called a function, occurs extensively in mathematics. A function is a relation that assigns to each element in its domain exactly one element in the range. For each ordered pair in the relation, each x-value is matched with only one y-value.

The birthday example from Example 2 helps us understand this definition. Every person has a birthday but no one has two birthdays. It is okay for two people to share a birthday. It is okay that Danny and Stephen share July 24th as their birthday and that June and Liz share August 2nd. Since each person has exactly one birthday, the relation in Example 2 is a function.

The relation shown by the graph in Example 3 includes the ordered pairs (−3,−1) and (−3,4). Is that okay in a function? No, as this is like one person having two different birthdays.

In algebra, more often than not, functions will be represented by an equation. It is easiest to see if the equation is a function when it is solved for y. If each value of x results in only one value of y, then the equation defines a function.

Find the Value of a Function

It is very convenient to name a function and most often we name it f, g, h, F, G, or H. In any function, for each x-value from the domain we get a corresponding y-value in the range. For the function f, we write this range value y as f(x). This is called function notation and is read f of x or the value of f at x. In this case the parentheses does not indicate multiplication.

We call x the independent variable as it can be any value in the domain. We call y the dependent variable as its value depends on x.

Much as when you first encountered the variable x, function notation may be rather unsettling. It seems strange because it is new. You will feel more comfortable with the notation as you use it.

Let’s look at the equation y=4x5. To find the value of y when x=2, we know to substitute x=2 into the equation and then simplify.

A linear equation is displayed as y = 4x - 5, representing a straight line with a slope of 4 and a y-intercept of -5.
Let x=2.
A mathematical equation reads y = 4 ×7 2 ×1 5, where the number 2 is highlighted in red. This shows the initial setup for solving for y.
The equation y = 3 is displayed on a white background, representing a horizontal line in a Cartesian coordinate system where the y-coordinate for any point on the line is always 3.

The value of the function at x=2 is 3.

We do the same thing using function notation, the equation y=4x5 can be written as f(x)=4x5. To find the value when x=2, we write:

The image displays the function f(x) = 4x - 5, a linear equation often encountered in algebra and pre-calculus.
Let x=2.
A mathematical equation showing the function f evaluated at 2, expressed as f(2) = 4 * 2 - 5. The number 2 in '4 * 2' is highlighted in red.
The mathematical equation f(2) = 3 is displayed on a white background.

The value of the function at x=2 is 3.

This process of finding the value of f(x) for a given value of x is called evaluating the function.

In the last example, we found f(x) for a constant value of x. In the next example, we are asked to find g(x) with values of x that are variables. We still follow the same procedure and substitute the variables in for the x.

Many everyday situations can be modeled using functions.

Key Concepts

  • Function Notation: For the function y=f(x)
    • f is the name of the function
    • x is the domain value
    • f(x) is the range value y corresponding to the value x
      We read f(x) as f of x or the value of f at x.
  • Independent and Dependent Variables: For the function y=f(x),
    • x is the independent variable as it can be any value in the domain
    • y is the dependent variable as its value depends on x

Practice Makes Perfect

Find the Domain and Range of a Relation

In the following exercises, for each relation ⓐ find the domain of the relation ⓑ find the range of the relation.

{(1,4),(2,8),(3,12),(4,16),(5,20)}

ⓐ {1, 2, 3, 4, 5} ⓑ {4, 8, 12, 16, 20}

{(1,−2),(2,−4),(3,−6),(4,−8),(5,−10)}

{(1,7),(5,3),(7,9),(−2,−3),(−2,8)}

ⓐ {1, 5, 7, −2} ⓑ {7, 3, 9, −3, 8}

{(11,3),(−2,−7),(4,−8),(4,17),(−6,9)}

In the following exercises, use the mapping of the relation to ⓐ list the ordered pairs of the relation, ⓑ find the domain of the relation, and ⓒ find the range of the relation.
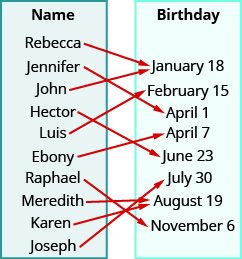
This figure shows two table that each have one column. The table on the left has the header “Name” and lists the names “Rebecca”, “Jennifer”, “John”, “Hector”, “Luis”, “Ebony”, “Raphael”, “Meredith”, “Karen”, and “Joseph”. The table on the right has the header “Birthday” and lists the dates “January 18”, “February 15”, “April 1”, “April 7”, “June 23”, “July 30”, “August 19”, and “November 6”. There are arrows starting at names in the Name table and pointing towards dates in the Birthday table. The first arrow goes from Rebecca to January 18. The second arrow goes from Jennifer to April 1. The third arrow goes from John to January 18. The fourth arrow goes from Hector to June 23. The fifth arrow goes from Luis to February 15. The sixth arrow goes from Ebony to April 7. The seventh arrow goes from Raphael to November 6. The eighth arrow goes from Meredith to August 19. The ninth arrow goes from Karen to August 19. The tenth arrow goes from Joseph to July 30.

ⓐ (Rebecca, January 18), (Jennifer, April 1), (John, January 18), (Hector, June 23), (Luis, February 15), (Ebony, April 7), (Raphael, November 6), (Meredith, August 19), (Karen, August 19), (Joseph, July 30)
ⓑ {Rebecca, Jennifer, John, Hector, Luis, Ebony, Raphael, Meredith, Karen, Joseph}
ⓒ {January 18, April 1, June 23, February 15, April 7, November 6, August 19, July 30}
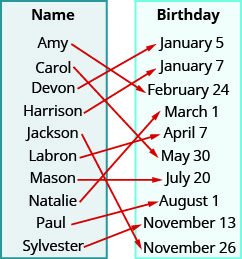
This figure shows two table that each have one column. The table on the left has the header “Name” and lists the names “Amy”, “Carol”, “Devon”, “Harrison”, “Jackson”, “Labron”, “Mason”, “Natalie”, “Paul”, and “Sylvester”. The table on the right has the header “Birthday” and lists the dates “January 5”, “January 7”, “February 14”, “March 1”, “April 7”, “May 30”, “July 20”, “August 1”, “November 13”, and “November 26”. There are arrows starting at names in the Name table and pointing towards dates in the Birthday table. The first arrow goes from Amy to February 14. The second arrow goes from Carol to May 30. The third arrow goes from Devon to January 5. The fourth arrow goes from Harrison to January 7. The fifth arrow goes from Jackson to November 26. The sixth arrow goes from Labron to April 7. The seventh arrow goes from Mason to July 20. The eighth arrow goes from Natalie to March 1. The ninth arrow goes from Paul to August 1. The tenth arrow goes from Sylvester to November 13.

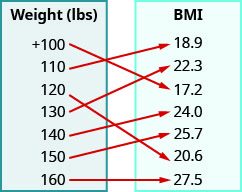
For a woman of height 54 the mapping below shows the corresponding Body Mass Index (BMI). The body mass index is a measurement of body fat based on height and weight. A BMI of 18.524.9 is considered healthy.

This figure shows two table that each have one column. The table on the left has the header “Weight (lbs)” and lists the numbers plus 100, 110, 120, 130, 140, 150, and 160. The table on the right has the header “BMI” and lists the numbers 18. 9, 22. 3, 17. 2, 24. 0, 25. 7, 20. 6, and 27. 5. There are arrows starting at numbers in the weight table and pointing towards numbers in the BMI table. The first arrow goes from plus 100 to 17. 2. The second arrow goes from 110 to 18. 9. The third arrow goes from 120 to 20. 6. The fourth arrow goes from 130 to 22. 3. The fifth arrow goes from 140 to 24. 0. The sixth arrow goes from 150 to 25. 7. The seventh arrow goes from 160 to 27. 5.

ⓐ (+100, 17. 2), (110, 18.9), (120, 20.6), (130, 22.3), (140, 24.0), (150, 25.7), (160, 27.5) ⓑ {+100, 110, 120, 130, 140, 150, 160,} ⓒ {17.2, 18.9, 20.6, 22.3, 24.0, 25.7, 27.5}

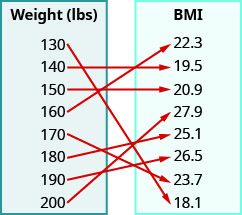
For a man of height 511 the mapping below shows the corresponding Body Mass Index (BMI). The body mass index is a measurement of body fat based on height and weight. A BMI of 18.524.9 is considered healthy.

This figure shows two table that each have one column. The table on the left has the header “Weight (lbs)” and lists the numbers 130, 140, 150, 160, 170, 180, 190, and 200. The table on the right has the header “BMI” and lists the numbers 22. 3, 19. 5, 20. 9, 27. 9, 25. 1, 26. 5, 23. 7, and 18. 1. There are arrows starting at numbers in the weight table and pointing towards numbers in the BMI table. The first arrow goes from 130 to 18. 1. The second arrow goes from 140 to 19. 5. The third arrow goes from 150 to 20. 9. The fourth arrow goes from 160 to 22. 3. The fifth arrow goes from 170 to 23. 7. The sixth arrow goes from 180 to 25. 1. The seventh arrow goes from 190 to 26. 5. The eighth arrow goes from 200 to 27. 9.

In the following exercises, use the graph of the relation to ⓐ list the ordered pairs of the relation ⓑ find the domain of the relation ⓒ find the range of the relation.
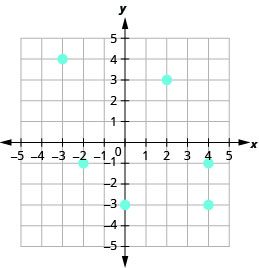
The figure shows the graph of some points on the x y-coordinate plane. The x and y-axes run from negative 6 to 6. The points (negative 3, 4), (negative 3, negative 1), (0, negative 3), (2, 3), (4, negative 1), and (4, negative 3).

ⓐ (2, 3), (4, −3), (−2, −1), (−3, 4), (4, −1), (0, −3) ⓑ {−3, −2, 0, 2, 4}
ⓒ {−3, −1, 3, 4}
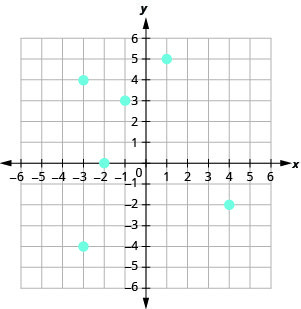
The figure shows the graph of some points on the x y-coordinate plane. The x and y-axes run from negative 6 to 6. The points (negative 3, 4), (negative 3, negative 4), (negative 2, 0), (negative 1, 3), (1, 5), and (4, negative 2).

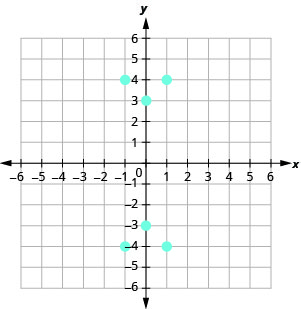
The figure shows the graph of some points on the x y-coordinate plane. The x and y-axes run from negative 6 to 6. The points (negative 1, 4), (negative 1, negative 4), (0, 3), (0, negative 3), (1, 4), and (1, negative 4).

ⓐ (1, 4), (1, −4), (−1, 4), (−1, −4), (0, 3), (0, −3) ⓑ {−1, 0, 1} ⓒ {−4, −3, 3,4}
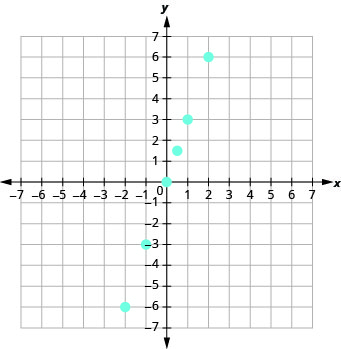
The figure shows the graph of some points on the x y-coordinate plane. The x and y-axes run from negative 10 to 10. The points (negative 2, negative 6), (negative 2, negative 3), (0, 0), (0. 5, 1. 5), (1, 3), and (3, 6).

Determine if a Relation is a Function

In the following exercises, use the set of ordered pairs to ⓐ determine whether the relation is a function, ⓑ find the domain of the relation, and ⓒ find the range of the relation.

{(−3,9),(−2,4),(−1,1),
(0,0),(1,1),(2,4),(3,9)}

ⓐ yes ⓑ {−3, −2, −1, 0, 1, 2, 3} ⓒ {9, 4, 1, 0}

{(9,−3),(4,−2),(1,−1),
(0,0),(1,1),(4,2),(9,3)}

{(−3,27),(−2,8),(−1,1),
(0,0),(1,1),(2,8),(3,27)}

ⓐ yes ⓑ {−3, −2, −1, 0, 1, 2, 3} ⓒ 0, 1, 8, 27}

{(−3,−27),(−2,−8),(−1,−1),
(0,0),(1,1),(2,8),(3,27)}

In the following exercises, use the mapping to ⓐ determine whether the relation is a function, ⓑ find the domain of the function, and ⓒ find the range of the function.
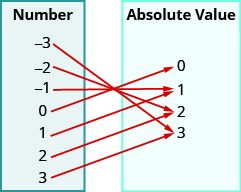
This figure shows two table that each have one column. The table on the left has the header “Number” and lists the numbers negative 3, negative 2, negative 1, 0, 1, 2, and 3. The table on the right has the header “Absolute Value” and lists the numbers 0, 1, 2, and 3. There are arrows starting at numbers in the number table and pointing towards numbers in the absolute value table. The first arrow goes from negative 3 to 3. The second arrow goes from negative 2 to 2. The third arrow goes from negative 1 to 1. The fourth arrow goes from 0 to 0. The fifth arrow goes from 1 to 1. The sixth arrow goes from 2 to 2. The seventh arrow goes from 3 to 3.

ⓐ yes ⓑ {−3, −2, −1, 0, 1, 2, 3} ⓒ {0, 1, 2, 3}
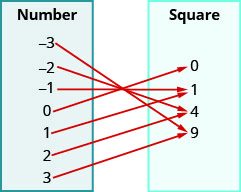
This figure shows two table that each have one column. The table on the left has the header “Number” and lists the numbers negative 3, negative 2, negative 1, 0, 1, 2, and 3. The table on the right has the header “Square” and lists the numbers 0, 1, 4, and 9. There are arrows starting at numbers in the number table and pointing towards numbers in the square table. The first arrow goes from negative 3 to 9. The second arrow goes from negative 2 to 4. The third arrow goes from negative 1 to 1. The fourth arrow goes from 0 to 0. The fifth arrow goes from 1 to 1. The sixth arrow goes from 2 to 4. The seventh arrow goes from 3 to 9.

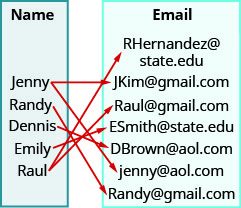
This figure shows two table that each have one column. The table on the left has the header “Name” and lists the names “Jenny”, “R and y”, “Dennis”, “Emily”, and “Raul”. The table on the right has the header “Email” and lists the email addresses RHern and ez@state. edu, JKim@gmail.com, Raul@gmail.com, ESmith@state. edu, DBrown@aol.com, jenny@aol.com, and R and y@gmail.com. There are arrows starting at names in the name table and pointing towards addresses in the email table. The first arrow goes from Jenny to JKim@gmail.com. The second arrow goes from Jenny to jenny@aol.com. The third arrow goes from R and y to R and y@gmail.com. The fourth arrow goes from Dennis to DBrown@aol.com. The fifth arrow goes from Emily to ESmith@state. edu. The sixth arrow goes from Raul to RHern and ez@state. edu. The seventh arrow goes from Raul to Raul@gmail.com.

ⓐ no ⓑ {Jenny, R and y, Dennis, Emily, Raul} ⓒ {RHern and ez@state.edu, JKim@gmail.com, Raul@gmail.com, ESmith@state.edu, DBroen@aol.com, jenny@aol.cvom, R and y@gmail.com}
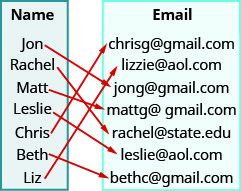
This figure shows two table that each have one column. The table on the left has the header “Name” and lists the names “Jon”, “Rachel”, “Matt”, “Leslie”, “Chris”, “Beth”, and “Liz”. The table on the right has the header “Email” and lists the email addresses chrisg@gmail.com, lizzie@aol.com, jong@gmail.com, mattg@gmail.com, Rachel@state. edu, leslie@aol.com, and bethc@gmail.com. There are arrows starting at names in the name table and pointing towards addresses in the email table. The first arrow goes from Jon to jong@gmail.com. The second arrow goes from Rachel to Rachel@state. edu. The third arrow goes from Matt to mattg@gmail.com. The fourth arrow goes from Leslie to leslie@aol.com. The fifth arrow goes from Chris to chrisg@gmail.com. The sixth arrow goes from Beth to bethc@gmail.com. The seventh arrow goes from Liz to lizzie@aol.com.

In the following exercises, determine whether each equation is a function.

2x+y=−3
y=x2
x+y2=−5

ⓐ yes ⓑ yes ⓒ no

y=3x5
y=x3
2x+y2=4

y3x3=2
x+y2=3
3x2y=6

ⓐ yes ⓑ no ⓒ yes

2x4y=8
−4=x2y
y2=x+5

Find the Value of a Function

In the following exercises, evaluate the function: ⓐ f(2)f(−1)f(a).

f(x)=5x3

f(2)=7f(−1)=−8f(a)=5a3

f(x)=3x+4

f(x)=−4x+2

f(2)=−6f(−1)=6f(a)=−4a+2

f(x)=−6x3

f(x)=x2x+3

f(2)=5f(−1)=5
f(a)=a2a+3

f(x)=x2+x2

f(x)=2x2x+3

f(2)=9f(−1)=6
f(a)=2a2a+3

f(x)=3x2+x2

In the following exercises, evaluate the function: ⓐ g(h2)g(x+2)g(x)+g(2).

g(x)=2x+1

g(h2)=2h2+1
g(x+2)=2x+5
g(x)+g(2)=2x+6

g(x)=5x8

g(x)=−3x2

g(h2)=−3h22
g(x+2)=−3x8
g(x)+g(2)=−3x10

g(x)=−8x+2

g(x)=3x

g(h2)=3h2
g(x+2)=1x
g(x)+g(2)=4x

g(x)=75x

In the following exercises, evaluate the function.

f(x)=3x25x; f(2)

2

g(x)=4x23x; g(3)

F(x)=2x23x+1;
F(−1)

6

G(x)=3x25x+2;
G(−2)

h(t)=2|t5|+4; h(−4)

22

h(y)=3|y1|3; h(−4)

f(x)=x+2x1; f(2)

4

g(x)=x2x+2; g(4)

In the following exercises, solve.

The number of unwatched shows in Sylvia’s DVR is 85. This number grows by 20 unwatched shows per week. The function N(t)=85+20t represents the relation between the number of unwatched shows, N, and the time, t, measured in weeks.

ⓐ Determine the independent and dependent variable.

ⓑ Find N(4). Explain what this result means

t IND; N DEP
N(4)=165 the number of unwatched shows in Sylvia’s DVR at the fourth week.

Every day a new puzzle is downloaded into Ken’s account. Right now he has 43 puzzles in his account. The function N(t)=43+t represents the relation between the number of puzzles, N, and the time, t, measured in days.

ⓐ Determine the independent and dependent variable.

ⓑ Find N(30). Explain what this result means.

The daily cost to the printing company to print a book is modeled by the function C(x)=3.25x+1500 where C is the total daily cost in dollars and x is the number of books printed.

ⓐ Determine the independent and dependent variable.

ⓑ Find C(0). Explain what this result means.

ⓒ Find C(1000). Explain what this result means.

x IND; C DEP
N(0)=1500 the daily cost if no books are printed
N(1000)=4750 the daily cost of printing 1000 books

The daily cost to the manufacturing company is modeled by the function C(x)=7.25x+2500 where C(x) is the total daily cost and x is the number of items manufactured.

ⓐ Determine the independent and dependent variable.

ⓑ Find C(0). Explain what this result means.

ⓒ Find C(1000). Explain what this result means.

Writing Exercises

In your own words, explain the difference between a relation and a function.

In your own words, explain what is meant by domain and range.

Is every relation a function? Is every function a relation?

How do you find the value of a function?

Self Check

ⓐ After completing the exercises, use this checklist to evaluate your mastery of the objectives of this section.
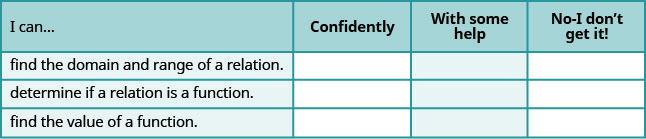
The figure shows a table with four rows and four columns. The first row is a header row and it labels each column. The first column header is “I can…”, the second is “confidently”, the third is “with some help”, “no minus I don’t get it!”. Under the first column are the phrases “find the domain and range of a relation”, “determine if a relation is a function”, and “find the value of a function”. Under the second, third, fourth columns are blank spaces where the learner can check what level of mastery they have achieved.

ⓑ After looking at the checklist, do you think you are well-prepared for the next section? Why or why not?