
3.4 Graph Linear Inequalities in Two Variables
Verify Solutions to an Inequality in Two Variables
Previously we learned to solve inequalities with only one variable. We will now learn about inequalities containing two variables. In particular we will look at linear inequalities in two variables which are very similar to linear equations in two variables.
Linear inequalities in two variables have many applications. If you ran a business, for example, you would want your revenue to be greater than your costs—so that your business made a profit.
Recall that an inequality with one variable had many solutions. For example, the solution to the inequality is any number greater than 3. We showed this on the number line by shading in the number line to the right of 3, and putting an open parenthesis at 3. See Figure 3.10.

Similarly, linear inequalities in two variables have many solutions. Any ordered pair that makes an inequality true when we substitute in the values is a solution to a linear inequality.
Recognize the Relation Between the Solutions of an Inequality and its Graph
Now, we will look at how the solutions of an inequality relate to its graph.
Let’s think about the number line in shown previously again. The point separated that number line into two parts. On one side of 3 are all the numbers less than 3. On the other side of 3 all the numbers are greater than 3. See Figure 3.11.

Similarly, the line separates the plane into two regions. On one side of the line are points with On the other side of the line are the points with We call the line a boundary line.
For an inequality in one variable, the endpoint is shown with a parenthesis or a bracket depending on whether or not a is included in the solution:

Similarly, for an inequality in two variables, the boundary line is shown with a solid or dashed line to show whether or not it the line is included in the solution.
Now, let’s take a look at what we found in Example 1. We’ll start by graphing the line and then we’ll plot the five points we tested, as shown in the graph. See Figure 3.12.
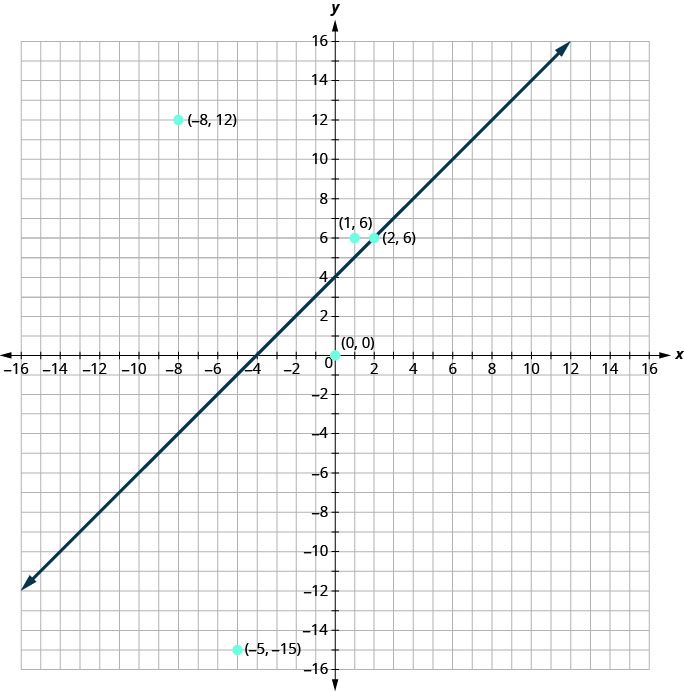
In Example 1 we found that some of the points were solutions to the inequality and some were not.
Which of the points we plotted are solutions to the inequality
The points and are solutions to the inequality Notice that they are both on the same side of the boundary line
The two points and are on the other side of the boundary line and they are not solutions to the inequality For those two points,
What about the point Because the point is a solution to the equation but not a solution to the inequality So the point is on the boundary line.
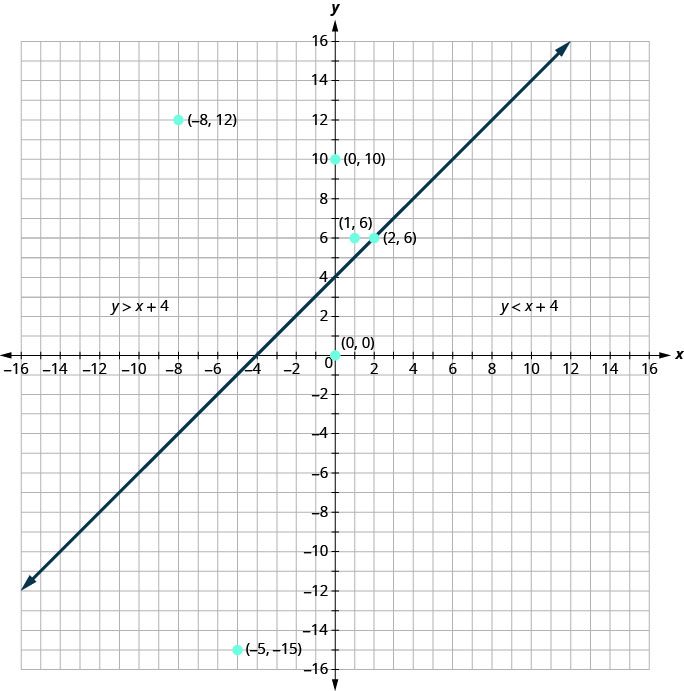
Let’s take another point above the boundary line and test whether or not it is a solution to the inequality The point clearly looks to above the boundary line, doesn’t it? Is it a solution to the inequality?
So, is a solution to
Any point you choose above the boundary line is a solution to the inequality All points above the boundary line are solutions.
Similarly, all points below the boundary line, the side with and are not solutions to as shown in Figure 3.13.
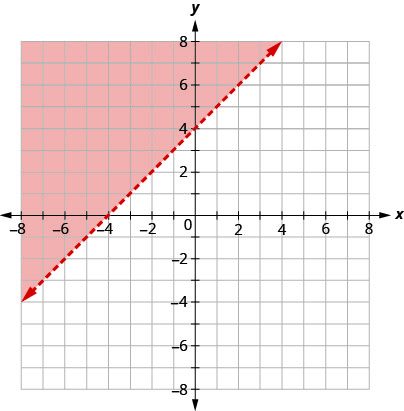
The graph of the inequality is shown in below.
The line divides the plane into two regions. The shaded side shows the solutions to the inequality
The points on the boundary line, those where are not solutions to the inequality so the line itself is not part of the solution. We show that by making the line dashed, not solid.
Graph Linear Inequalities in Two Variables
Now that we know what the graph of a linear inequality looks like and how it relates to a boundary equation we can use this knowledge to graph a given linear inequality.
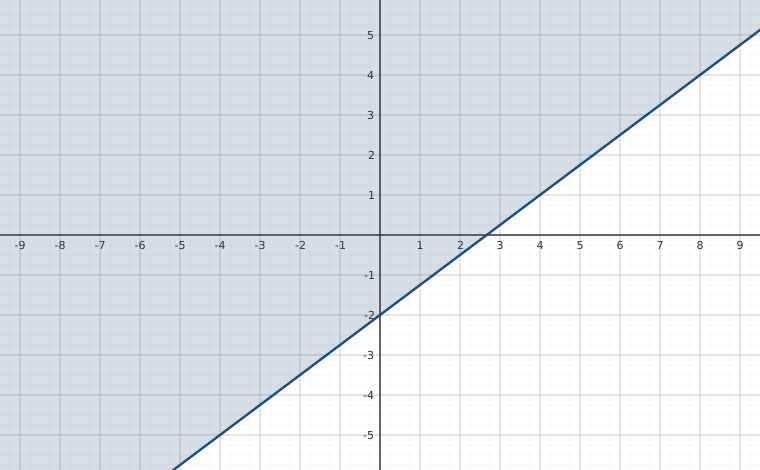
The steps we take to graph a linear inequality are summarized here.
What if the boundary line goes through the origin? Then, we won’t be able to use as a test point. No problem—we’ll just choose some other point that is not on the boundary line.
Some linear inequalities have only one variable. They may have an x but no y, or a y but no x. In these cases, the boundary line will be either a vertical or a horizontal line.
Recall that:
Solve Applications using Linear Inequalities in Two Variables
Many fields use linear inequalities to model a problem. While our examples may be about simple situations, they give us an opportunity to build our skills and to get a feel for how they might be used.
Key Concepts
- How to graph a linear inequality in two variables.
- Identify and graph the boundary line.
If the inequality is the boundary line is solid.
If the inequality is the boundary line is dashed. - Test a point that is not on the boundary line. Is it a solution of the inequality?
- Shade in one side of the boundary line.
If the test point is a solution, shade in the side that includes the point.
If the test point is not a solution, shade in the opposite side.
- Identify and graph the boundary line.
Practice Makes Perfect
Verify Solutions to an Inequality in Two Variables
In the following exercises, determine whether each ordered pair is a solution to the given inequality.
Determine whether each ordered pair is a solution to the inequality
ⓐ
ⓑ
ⓒ
ⓓ
ⓔ
ⓐ yes ⓑ yes ⓒ no ⓓ no ⓔ no
Determine whether each ordered pair is a solution to the inequality
ⓐ
ⓑ
ⓒ
ⓓ
ⓔ
Determine whether each ordered pair is a solution to the inequality
ⓐ
ⓑ
ⓒ
ⓓ
ⓔ
ⓐ no ⓑ no ⓒ no ⓓ yes ⓔ no
Determine whether each ordered pair is a solution to the inequality
ⓐ
ⓑ
ⓒ
ⓓ
ⓔ
Determine whether each ordered pair is a solution to the inequality
ⓐ
ⓑ
ⓒ
ⓓ
ⓔ
ⓐ yes ⓑ no ⓒ no ⓓ yes ⓔ no
Determine whether each ordered pair is a solution to the inequality
ⓐ
ⓑ
ⓒ
ⓓ
ⓔ
Recognize the Relation Between the Solutions of an Inequality and its Graph
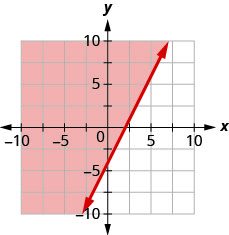
In the following exercises, write the inequality shown by the shaded region.
Write the inequality shown by the graph with the boundary line
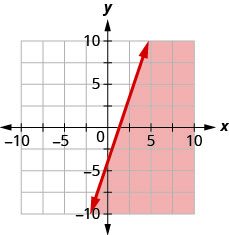
Write the inequality shown by the graph with the boundary line
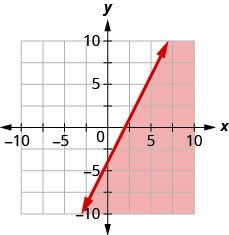
Write the inequality shown by the graph with the boundary line
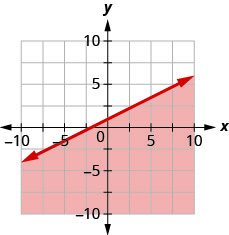
Write the inequality shown by the graph with the boundary line
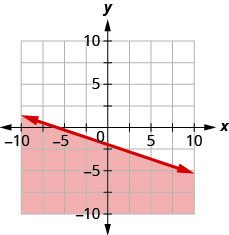
Write the inequality shown by the shaded region in the graph with the boundary line
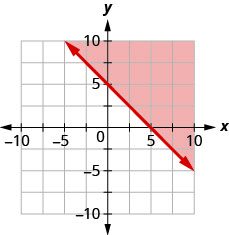
Write the inequality shown by the shaded region in the graph with the boundary line
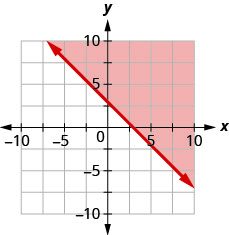
Write the inequality shown by the shaded region in the graph with the boundary line
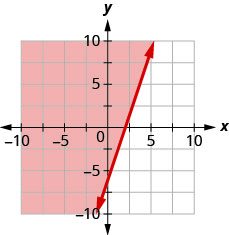
Write the inequality shown by the shaded region in the graph with the boundary line
Graph Linear Inequalities in Two Variables
In the following exercises, graph each linear inequality.
Graph the linear inequality:
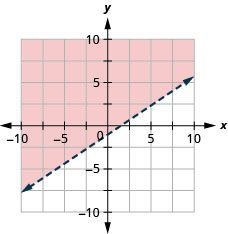
Graph the linear inequality:
Graph the linear inequality:
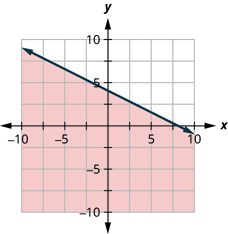
Graph the linear inequality:
Graph the linear inequality:
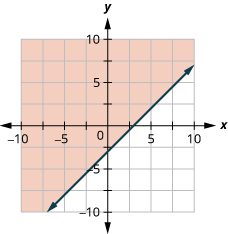
Graph the linear inequality:
Graph the linear inequality:
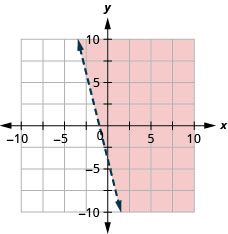
Graph the linear inequality:
Graph the linear inequality:
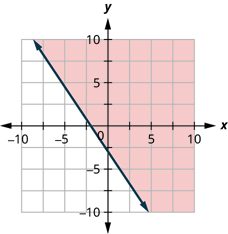
Graph the linear inequality:
Graph the linear inequality:
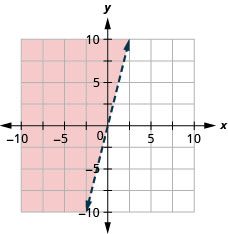
Graph the linear inequality:
Graph the linear inequality:
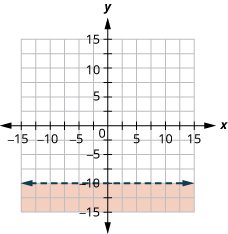
Graph the linear inequality:
Graph the linear inequality:
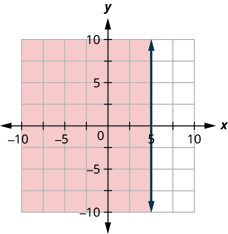
Graph the linear inequality:
Graph the linear inequality:
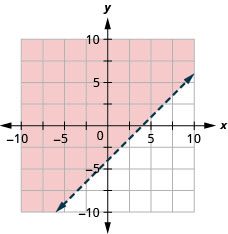
Graph the linear inequality:
Graph the linear inequality:
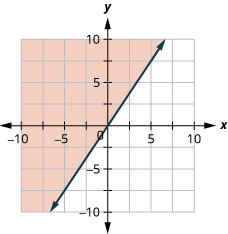
Graph the linear inequality:
Graph the linear inequality:
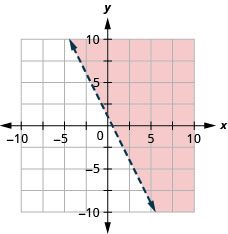
Graph the linear inequality:
Graph the linear inequality:
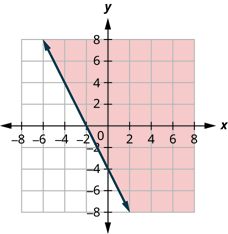
Graph the linear inequality:
Graph the linear inequality:
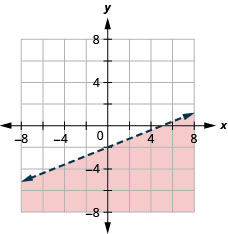
Graph the linear inequality:
Solve Applications using Linear Inequalities in Two Variables
Harrison works two part time jobs. One at a gas station that pays $11 an hour and the other is IT troubleshooting for an hour. Between the two jobs, Harrison wants to earn at least $330 a week. How many hours does Harrison need to work at each job to earn at least $330?
ⓐ Let x be the number of hours he works at the gas station and let y be the number of (hours he works troubleshooting. Write an inequality that would model this situation.
ⓑ Graph the inequality.
ⓒ Find three ordered pairs that would be solutions to the inequality. Then, explain what that means for Harrison.
ⓐ
ⓑ
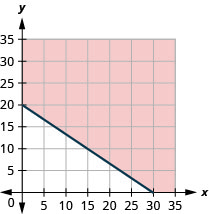
ⓒ Answers will vary.
Elena needs to earn at least $450 a week during her summer break to pay for college. She works two jobs. One as a swimming instructor that pays $9 an hour and the other as an intern in a genetics lab for $22.50 per hour. How many hours does Elena need to work at each job to earn at least $450 per week?
ⓐ Let x be the number of hours she works teaching swimming and let y be the number of hours she works as an intern. Write an inequality that would model this situation.
ⓑ Graph the inequality.
ⓒ Find three ordered pairs that would be solutions to the inequality. Then, explain what that means for Elena.
The doctor tells Laura she needs to exercise enough to burn 500 calories each day. She prefers to either run or bike and burns 15 calories per minute while running and 10 calories a minute while biking.
ⓐ If x is the number of minutes that Laura runs and y is the number minutes she bikes, find the inequality that models the situation.
ⓑ Graph the inequality.
ⓒ List three solutions to the inequality. What options do the solutions provide Laura?
ⓐ
ⓑ
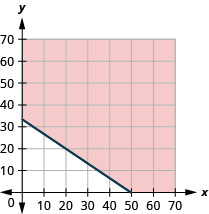
ⓒ Answers will vary.
Armando’s workouts consist of kickboxing and swimming. While kickboxing, he burns 10 calories per minute and he burns 7 calories a minute while swimming. He wants to burn 600 calories each day.
ⓐ If x is the number of minutes that Armando will kickbox and y is the number minutes he will swim, find the inequality that will help Armando create a workout for today.
ⓑ Graph the inequality.
ⓒ List three solutions to the inequality. What options do the solutions provide Armando?
Writing Exercises
Lester thinks that the solution of any inequality with a sign is the region above the line and the solution of any inequality with a sign is the region below the line. Is Lester correct? Explain why or why not.
Answers will vary.
Explain why, in some graphs of linear inequalities, the boundary line is solid but in other graphs it is dashed.
Self Check
ⓐ After completing the exercises, use this checklist to evaluate your mastery of the objectives of this section.
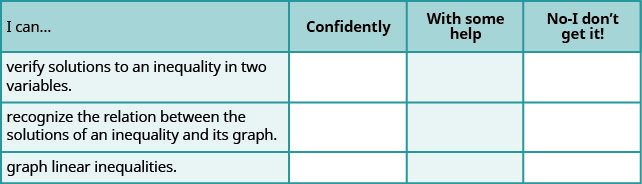
ⓑ On a scale of 1–10, how would you rate your mastery of this section in light of your responses on the checklist? How can you improve this?
Adapted from Intermediate Algebra 2e by OpenStax (openstax.org), licensed under CC BY-NC-SA 4.0. Changes were made. License: CC-BY-NC-SA-4.0.