
9.8 Real Data
Let’s go through the process of looking at a 2x2 factorial design in the wild. This will be the very same data that you will analyze in the lab for factorial designs.
9.8.1 Stand at attention
Do you pay more attention when you are sitting or standing? This was the kind of research question the researchers were asking in the study we will look at. In fact, the general question and design is very similar to our fake study idea that we used to explain factorial designs in this chapter.
The paper we look at is called “Stand by your Stroop: Standing up enhances selective attention and cognitive control” (Rosenbaum, Mama, and Algom 2017). This paper asked whether sitting versus standing would influence a measure of selective attention, the ability to ignore distracting information.
They used a classic test of selective attention, called the Stroop effect. You may already know what the Stroop effect is. In a typical Stroop experiment, subjects name the color of words as fast as they can. The trick is that sometimes the color of the word is the same as the name of the word, and sometimes it is not. Figure 9.9 shows some examples:
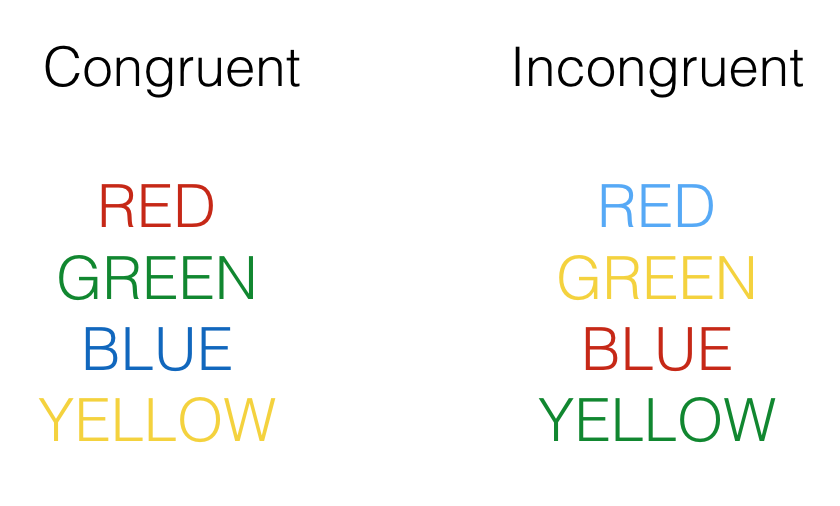
Congruent trials occur when the color and word match. So, the correct answers for each of the congruent stimuli shown would be to say, red, green, blue and yellow. Incongruent trials occur when the color and word mismatch. The correct answers for each of the incongruent stimuli would be: blue, yellow, red, green.
The Stroop effect is an example of a well-known phenomena. What happens is that people are faster to name the color of the congruent items compared to the color of the incongruent items. This difference (incongruent reaction time - congruent reaction time) is called the Stroop effect.
Many researchers argue that the Stroop effect measures something about selective attention, the ability to ignore distracting information. In this case, the target information that you need to pay attention to is the color, not the word. For each item, the word is potentially distracting, it is not information that you are supposed to respond to. However, it seems that most people can’t help but notice the word, and their performance in the color-naming task is subsequently influenced by the presence of the distracting word.
People who are good at ignoring the distracting words should have small Stroop effects. They will ignore the word, and it won’t influence them very much for either congruent or incongruent trials. As a result, the difference in performance (the Stroop effect) should be fairly small (if you have “good” selective attention in this task). People who are bad at ignoring the distracting words should have big Stroop effects. They will not ignore the words, causing them to be relatively fast when the word helps, and relatively slow when the word mismatches. As a result, they will show a difference in performance between the incongruent and congruent conditions.
If we take the size of the Stroop effect as a measure of selective attention, we can then start wondering what sorts of things improve selective attention (e.g., that make the Stroop effect smaller), and what kinds of things impair selective attention (e.g., make the Stroop effect bigger).
The research question of this study was to ask whether standing up improves selective attention compared to sitting down. They predicted smaller Stroop effects when people were standing up and doing the task, compared to when they were sitting down and doing the task.
The design of the study was a 2x2 repeated-measures design. The first IV was congruency (congruent vs incongruent). The second IV was posture (sitting vs. standing). The DV was reaction time to name the word.
9.8.2 Plot the data
They had subjects perform many individual trials responding to single Stroop stimuli, both congruent and incongruent. And they had subjects stand up sometimes and do it, and sit-down sometimes and do it. Figure 9.10 shows what they found:
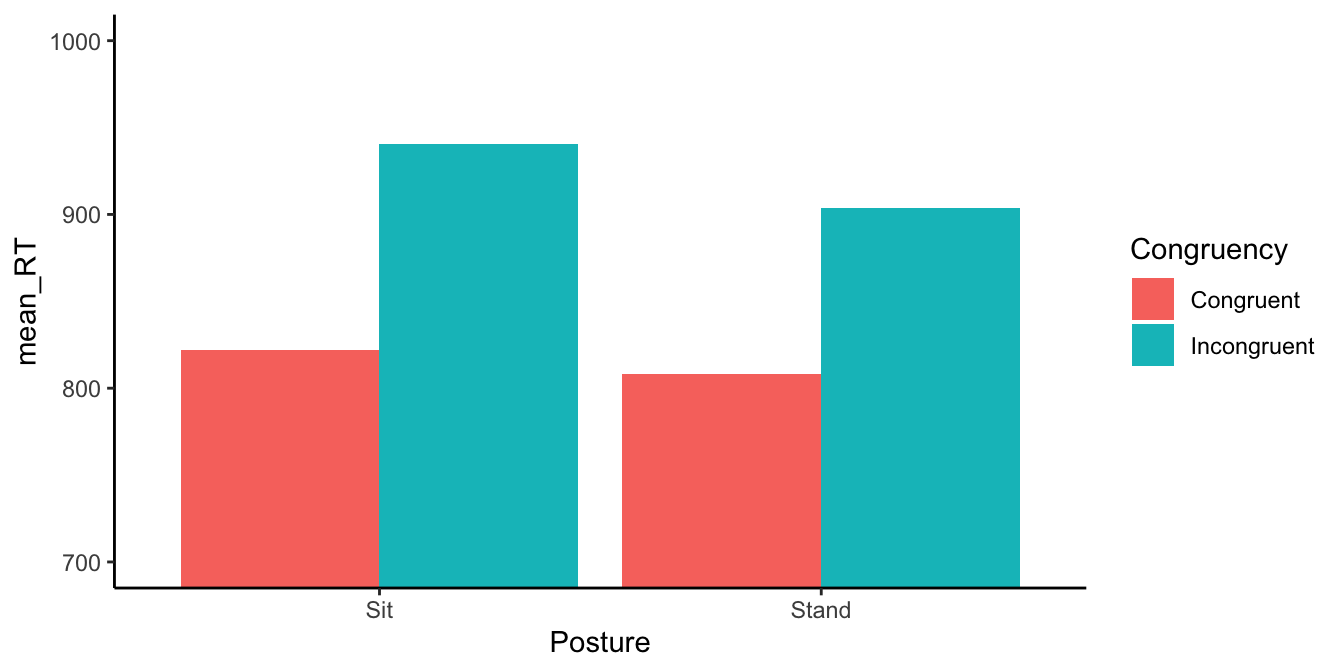
The figure shows the means. We can see that Stroop effects were observed in both the sitting position and the standing position. In the sitting position, mean congruent RTs were shorter than mean incongruent RTs (the red bar is lower than the aqua bar). The same general pattern is observed for the standing position. However, it does look as if the Stroop effect is slightly smaller in the stand condition: the difference between the red and aqua bars is slightly smaller compared to the difference when people were sitting.
9.8.3 Conduct the ANOVA
Let’s conduct a 2x2 repeated measures ANOVA on the data to evaluate whether the differences in the means are likely or unlikely to be due to chance. The ANOVA will give us main effects for congruency and posture (the two IVs), as well as one interaction effect to evaluate (congruency X posture). Remember, the interaction effect tells us whether the congruency effect changes across the levels of the posture manipulation.
| Df | Sum Sq | Mean Sq | F value | Pr(>F) | |
|---|---|---|---|---|---|
| Residuals | 49 | 2250738.636 | 45933.4416 | NA | NA |
| Congruency | 1 | 576821.635 | 576821.6349 | 342.452244 | 0.0000000 |
| Residuals | 49 | 82534.895 | 1684.3856 | NA | NA |
| Posture | 1 | 32303.453 | 32303.4534 | 7.329876 | 0.0093104 |
| Residuals1 | 49 | 215947.614 | 4407.0942 | NA | NA |
| Congruency:Posture | 1 | 6560.339 | 6560.3389 | 8.964444 | 0.0043060 |
| Residuals | 49 | 35859.069 | 731.8177 | NA | NA |
9.8.4 Main effect of Congruency
Let’s talk about each aspect of the ANOVA table, one step at a time. First, we see that there was a significant main effect of congruency, (1, 49) = 342.45, < 0.001. The value is extremely large, and the -value is so small it reads as a zero. This -value basically never happens by sampling error. We can be very confident that the overall mean difference between congruent and incongruent RTs was not caused by sampling error.
What were the overall mean differences between mean RTs in the congruent and incongruent conditions? We would have to look at those means to find out. Here’s a table:
| Congruency | mean_rt | sd | SEM |
|---|---|---|---|
| Congruent | 814.9415 | 111.3193 | 11.13193 |
| Incongruent | 922.3493 | 118.7960 | 11.87960 |
The table shows the mean RTs, standard deviation (sd), and standard error of the mean for each condition. These means show that there was a Stroop effect. Mean incongruent RTs were slower (larger number in milliseconds) than mean congruent RTs. The main effect of congruency is important for establishing that the researchers were able to measure the Stroop effect. However, the main effect of congruency does not say whether the size of the Stroop effect changed between the levels of the posture variable. So, this main effect was not particularly important for answering the specific question posed by the study.
9.8.5 Main effect of Posture
There was also a main effect of posture, (1,49) = 7.329, =0.009.
Let’s look at the overall means for the sitting and standing conditions and see what this is all about:
| Posture | mean_rt | sd | SEM |
|---|---|---|---|
| Sit | 881.3544 | 135.3842 | 13.53842 |
| Stand | 855.9365 | 116.9436 | 11.69436 |
Remember, the posture main effect collapses over the means in the congruency condition. We are not measuring a Stroop effect here. We are measuring a general effect of sitting vs standing on overall reaction time. The table shows that people were a little faster overall when they were standing, compared to when they were sitting.
Again, the main effect of posture was not the primary effect of interest. The authors weren’t interested if people are in general faster when they stand. They wanted to know if their selective attention would improve when they stand vs when they sit. They were most interested in whether the size of the Stroop effect (difference between incongruent and congruent performance) would be smaller when people stand, compared to when they sit. To answer this question, we need to look at the interaction effect.
9.8.6 Congruency X Posture Interaction
Last, there was a significant congruency X posture interaction, (1,49) = 8.96, = 0.004.
With this information, and by looking at the figure, we can get a pretty good idea of what this means. We know the size of the Stroop effect must have been different between the standing and sitting conditions, otherwise we would have gotten a smaller -value and a much larger -value.
We can see from the figure the direction of this difference, but let’s look at the table to see the numbers more clearly.
| Posture | Congruency | mean_rt | sd | SEM |
|---|---|---|---|---|
| Sit | Congruent | 821.9232 | 117.4069 | 16.60384 |
| Sit | Incongruent | 940.7855 | 126.6457 | 17.91041 |
| Stand | Congruent | 807.9599 | 105.6079 | 14.93521 |
| Stand | Incongruent | 903.9131 | 108.5366 | 15.34939 |
In the sitting condition the Stroop effect was roughly 941-822 = 119 ms.
In the standing condition the Stroop effect was roughly 904-808 = 96 ms.
So, the Stroop effect was 119-96 = 23 ms smaller when people were standing. This is a pretty small effect in terms of the amount of time reduced, but even though it is small, a difference even this big was not very likely to be due to chance.
9.8.7 What does it all mean?
Based on this research there appears to be some support for the following logic chain. First, the researchers can say that standing up reduces the size of a person’s Stroop effect. Fine, what could that mean? Well, if the Stroop effect is an index of selective attention, then it could mean that standing up is one way to improve your ability to selectively focus and ignore distracting information. The actual size of the benefit is fairly small, so the real-world implications are not that clear. Nevertheless, maybe the next time you lose your keys, you should stand up and look for them, rather than sitting down and not look for them.
Adapted from Answering Questions with Data: Introductory Statistics for Psychology Students, by Matthew J. C. Crump (Brooklyn College of CUNY), crumplab.com/statistics, licensed under CC BY-SA 4.0. Portions adapt Danielle Navarro's Learning Statistics with R (CC BY-SA). Changes were made; this adaptation is distributed under the same license. License: CC-BY-SA-4.0.