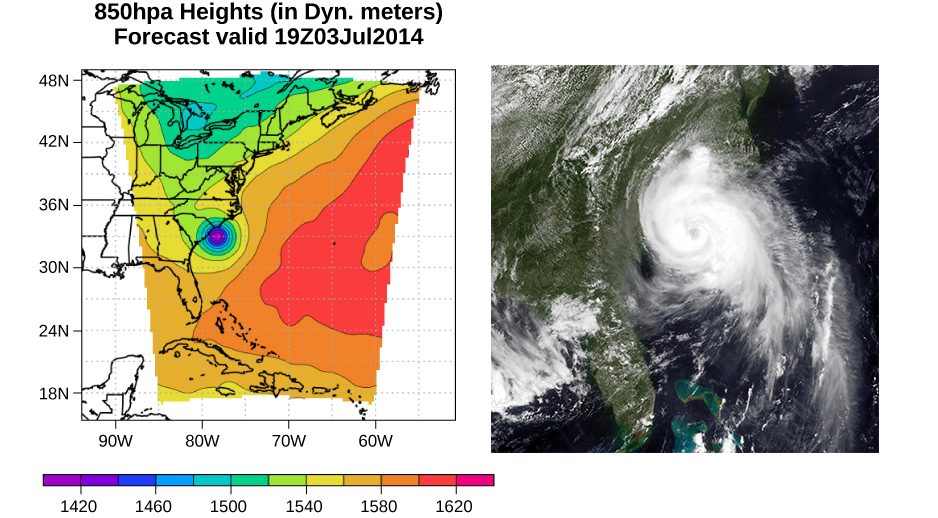
Figure 14.1This pressure map (left) and satellite photo (right) were used to model the path and impact of Hurricane Arthur as it traveled up the East Coast of the United States in July 2014. Computer models use force and energy equations to predict developing weather patterns. Scientists numerically integrate these time-dependent equations, along with the energy budgets of long- and short-wave solar energy, to model changes in the atmosphere. The pressure map on the left was created using the Weather Research and Forecasting Model designed at the National Center for Atmospheric Research. The colors represent the height of the 850-mbar pressure surface.This pressure map (left) and satellite photo (right) were used to model the path and impact of Hurricane Arthur as it traveled up the East Coast of the United States in July 2014. Computer models use force and energy equations to predict developing weather patterns. Scientists numerically integrate these time-dependent equations, along with the energy budgets of long- and short-wave solar energy, to model changes in the atmosphere. The pressure map on the left was created using the Weather Research and Forecasting Model designed at the National Center for Atmospheric Research. The colors represent the height of the 850-mbar pressure surface. (credit left: modification of work by The National Center for Atmospheric Research; credit right: modification of work by NRL Monterey Marine Meteorology Division, The National Oceanic and Atmospheric Administration)
Picture yourself walking along a beach on the eastern shore of the United States. The air smells of sea salt and the sun warms your body. Suddenly, an alert appears on your cell phone. A tropical depression has formed into a hurricane. Atmospheric pressure has fallen to nearly 15% below average. As a result, forecasters expect torrential rainfall, winds in excess of 100 mph, and millions of dollars in damage. As you prepare to evacuate, you wonder: How can such a small drop in pressure lead to such a severe change in the weather?
Pressure is a physical phenomenon that is responsible for much more than just the weather. Changes in pressure cause ears to “pop” during takeoff in an airplane. Changes in pressure can also cause scuba divers to suffer a sometimes fatal disorder known as the “bends,” which occurs when nitrogen dissolved in the water of the body at extreme depths returns to a gaseous state in the body as the diver surfaces. Pressure lies at the heart of the phenomena called buoyancy, which causes hot air balloons to rise and ships to float. Before we can fully understand the role that pressure plays in these phenomena, we need to discuss the states of matter and the concept of density.
Adapted from University Physics Volume 1 by OpenStax (openstax.org), licensed under CC BY-NC-SA 4.0. Changes were made. License: CC-BY-NC-SA-4.0.
These eBooks are a prerelease and are not yet certified conformant with WCAG 2.1 AA or ADA Title II. Every page is built against an automated accessibility gate, and the published editions will meet ADA Title II requirements when they release in late September 2026. If something is unusable, please tell us.