
7.3 Box Plot
Box plots (also called box-and-whisker plots or box-whisker plots) give a good graphical image of the concentration of the data. A box plot is constructed from five values: the minimum value, the first quartile, the median, the third quartile, and the maximum value.
Syntax
import matplotlib.pyplot as plt
plt.boxplot(x)
Example: The dataset below is scores of 20 students in a stat class. Construct a box plot.
81, 21, 53, 32, 80, 13, 26, 42, 35, 41, 14, 25, 87, 62, 46, 40, 32, 52, 85, 28, 17, 36, 83, 79, 18, 50, 17, 36, 36, 19
import matplotlib.pyplot as plt


x = [81, 21, 53, 32, 80, 13, 26, 42, 35, 41, 14, 25, 87, 62, 46, 40,
             32, 52, 85, 28, 17, 36, 83, 79, 18, 50, 17, 36, 36, 19]

plt.boxplot(x)

plt.suptitle("Box Plot")
plt.xlabel("Test Scores")
Show expected output
Text(0.5, 0, 'Test Scores')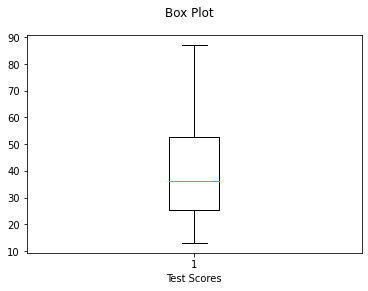
Example: The dataset below is scores of 20 students in a stat class. Construct a horizontal box plot. Horizontal box plot is useful for identifying the shape of the distribution.
81, 21, 53, 32, 80, 13, 26, 42, 35, 41, 14, 25, 87, 62, 46, 40, 32, 52, 85, 28, 17, 36, 83, 79, 18, 50, 17, 36, 36, 19
import matplotlib.pyplot as plt


x = [81, 21, 53, 32, 80, 13, 26, 42, 35, 41, 14, 25, 87, 62, 46, 40,
             32, 52, 85, 28, 17, 36, 83, 79, 18, 50, 17, 36, 36, 19]


plt.boxplot(x,vert=False)  # add vert=False
plt.suptitle("Box Plot")
plt.xlabel("Test Scores")
Show expected output
Text(0.5, 0, 'Test Scores')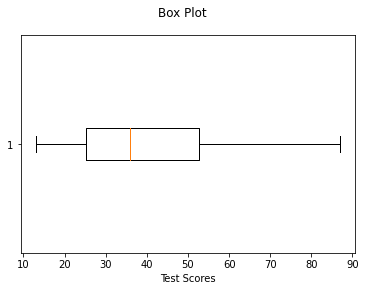
Example: Below is the list of ages of US Senators (2020). Write a program to draw a box plot.
81,81,80,80,80,80,78,78,78,77,77,75,75,74,74,74,73,72,72,71,71,71,71,70,70, 70,70,68,68,68,68,68,67,67,67,66,66,65,65,65,65,64,64,64,64,64,64,63,63, 63,63,62,62,62,62,62,61,61,61,60,60,59,59,59,59,59,59,59,59,58,58,57,57, 56,56,55,54,54,54,54,54,53,53,52,52,52,52,52,51,50,49,48,46,45,44,43,43, 43,42,41
import matplotlib.pyplot as plt


x = [81,81,80,80,80,80,78,78,78,77,77,75,75,74,74,74,73,72,72,71,71,71,71,70,70,
        70,70,68,68,68,68,68,67,67,67,66,66,65,65,65,65,64,64,64,64,64,64,63,63,
        63,63,62,62,62,62,62,61,61,61,60,60,59,59,59,59,59,59,59,59,58,58,57,57,
        56,56,55,54,54,54,54,54,53,53,52,52,52,52,52,51,50,49,48,46,45,44,43,43,
        43,42,41]

plt.boxplot(x)

plt.suptitle("Box Plot")
Show expected output
Text(0.5, 0.98, 'Box Plot')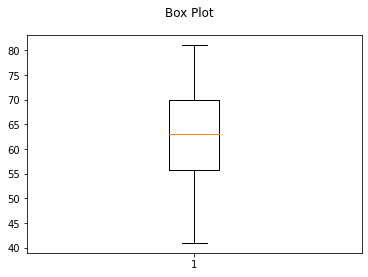
import matplotlib.pyplot as plt


x = [81,81,80,80,80,80,78,78,78,77,77,75,75,74,74,74,73,72,72,71,71,71,71,70,70,
        70,70,68,68,68,68,68,67,67,67,66,66,65,65,65,65,64,64,64,64,64,64,63,63,
        63,63,62,62,62,62,62,61,61,61,60,60,59,59,59,59,59,59,59,59,58,58,57,57,
        56,56,55,54,54,54,54,54,53,53,52,52,52,52,52,51,50,49,48,46,45,44,43,43,
        43,42,41]

plt.boxplot(x,vert=False)

plt.suptitle("Box Plot")

plt.xlabel("Age")
Show expected output
Text(0.5, 0, 'Age')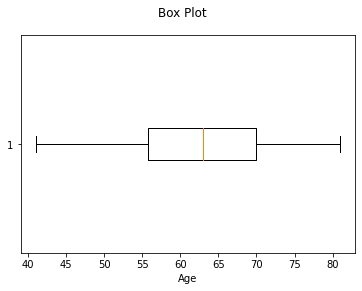
Outliers
Example: For the data below, construct a horizontal box plot to identify any outliers.
1, 2, 2, 3, 3, 3, 3, 4, 7, 9,25
import matplotlib.pyplot as plt

x=[1, 2, 2, 3, 3, 3, 3, 4, 7, 9,25]

plt.boxplot(x,vert=False)
plt.suptitle("Box Plot")
Show expected output
Text(0.5, 0.98, 'Box Plot')![Horizontal box plot of [1, 2, 2, 3, 3, 3, 3, 4, 7, 9, 25] titled Box Plot: the box sits between about 2.5 and 5.5, the upper whisker ends at 9, and 25 is drawn as a separate outlier point.](photos/ch07-img05.png)
25 is identified as an outlier in the boxplot above marked with o. Any value below the left whisker or above the right whisker is considered an outlier.
Adapted from Python for Introductory Statistics, by Simon Aman (Truman College, City Colleges of Chicago), licensed under CC BY 4.0. Changes were made: reformatted as an accessible XYZ web edition with live in-browser code cells. License: CC-BY-4.0.