

6B Bar Graphs, Pie Charts and Percent Applications
6B Bar Graphs, Pie Charts and Percent Applications
Read the transcriptDownload the videoNarration credits and licences
Percentages are a key part of math education. You cannot open a newspaper or go online without seeing percentages, but what are percentages? How do we use them and what are they used for? This section will strive to answer these key questions.
The 100 Principle
The word “Per-Cent” comes from two words “per” meaning to divide and “cent” meaning 100. So the percent symbol % really means divided by 100 or out of 100. The key to understanding percentages is that they are always based on the number 100.
For example, suppose we want to convert 34% into a fraction or decimal. Well as we have seen above, 34% is the same as . All we have to do is write the answer as a fraction or decimal. To convert 34% into a fraction we divide by 100 but write it as a fraction and simplify. So Hence as a fraction 34% means 17/50. Converting 34% into a decimal is the same. Again, 34% is the same as . If you remember from our decimal chapter, when you divide by 100 you move the decimal two places since there are two zeros in 100. Also dividing by 100 is making the number smaller, so we only need to move the decimal two places to the left. Hence 34% = = 0.34
We see that to convert a percent into a fraction or decimal we simply have to divide by 100.
Let’s look at a more complicated percentage . Suppose we want to write this as a fraction. Again the % means divide by 100. Therefore . If you remember from the fractions chapter we must convert both numbers to improper fractions. Once we convert the numbers into improper fractions, we can divide.
So we see that .
Being able to convert a percent into a fraction or decimal is vital, since in most percent application problems where a percent is given, you must first convert the percent to a fraction or decimal.
What if we want to convert a number into a percent? Remember, the key to percentages is 100. To convert a percent into a number we divide by 100, but if we want to make a number into a percent we need to do the opposite, multiply by 100. To convert a fraction or decimal into a percent, simply multiply by 100 and add on the % symbol.
For example, suppose we want to convert 0.017 into a percent. We just need to multiply by 100%. So 0.017 = 0.017 x 100%. When you multiply by 100 you move the decimal two places (since there are two zeros in 100). Since we are multiplying by 100 we are making the number larger so we must move the decimal to the right to make it larger. Hence we move the decimal two places to the right and we get the following:
So 0.017 = 0.017 x 100%. = 1.7%
The principle of 100 applies to fractions as well. Suppose we want to convert into a percent. Again to convert into a percent we multiply the number by 100%. So we need to multiply the fraction by 100 and usually we write the percent as a mixed number.
Principle of 100 rules: There are only two rules to remember when doing percent conversions, you will either multiply or divide by 100. To convert a fraction or decimal into a percent, we multiply the number by 100% and simplify. To convert a percent into a fraction or decimal we remove the % and divide by 100 and simplify. A good rule of thumb is if you see the symbol %, you will be dividing by 100. If you don’t see the symbol and you want to put one on, then you need to multiply by 100.
Try the following conversions with your instructor. Remember to use the principle of 100.
Using a Proportion
Solving applied percent problems with a proportion works very well. The main proportion to remember is
This proportion can be used in many applications. Remember, like most formulas, put in what you know and solve for what you do not know.
With the original denominators nonzero, to solve a proportion remember to set the cross products equal and solve.
So becomes
Let’s look at an example. For this exercise, assume that 39% of American adults will develop type 2 diabetes in their lifetime. If there are a total of 3500 adults in Julie’s hometown, how many should she expect to develop type 2 diabetes? Notice we know the percent and the total and are looking for the amount. Plugging into the proportion we get the following.
Notice 39% is 39/100. Now we set the cross products equal and solve.
So Julie can expect about 1365 adults in her hometown to develop type 2 diabetes in their lifetime.
Let’s look at a second example. A statistician took a random sample of 500 microchips and found that 6 of them were defective. What percent of the microchips were defective?
To solve this problem, we plug in what we know and solve for what we don’t know. In this case, we know the total and the amount, but not the percent. So we get the following.
Setting the cross products equal and solving we get the following.
Try the following examples with your instructor. Remember to use a proportion.
Common Graphs for Percentages: Bar Graphs and Pie charts
Percentages are often represented in graphs. Two common graphs in statistics is the “bar graph” (or bar chart) and the “pie chart” (or circle graph). These graphs give a visual comparison of values and percentages from different categories.
Look at the following example.
Notice the bar graph is a good way to summarize the data to the company. For example, they can see that that the number of employees that prefer Kaiser is about twice as much as Blue Shield and very few employees opted for no insurance.
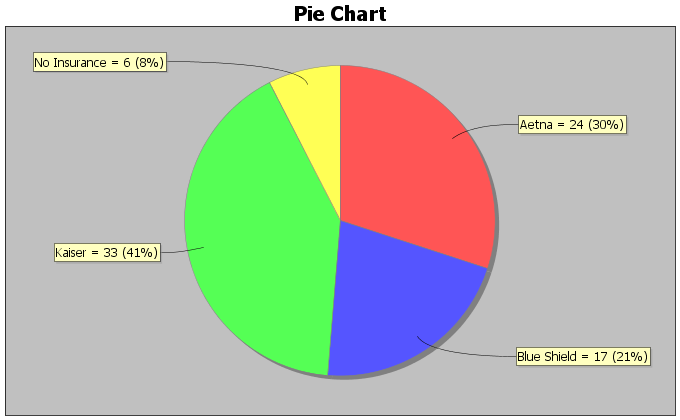
Notice the pie chart gives a part of the whole view and gives both the amount and the percentage. For example, using the rounded chart labels, the share of employees who prefer Kaiser (41%) is about 11 percentage points higher than the share who prefer Aetna (30%). From the displayed counts, 33 of 80 employees prefer Kaiser and 24 of 80 prefer Aetna: the exact shares are 41.25% and 30%, a difference of 11.25 percentage points. The relative increase in the employee count is a different comparison: 9 more than 24 is 37.5% more.
Now try the following example with your instructor.
Practice Problems Section 6B
Convert the following fractions into percentages by multiplying by 100% and simplifying. Write your answer as a mixed number when appropriate.
Check answer
75 %
Check answer
%
Check answer
%
Check answer
70 %
Check answer
%
Convert the following Decimals into percentages by multiplying by 100% and simplifying. Write your answer as a decimal.
0.43
Check answer
43 %
0.387
0.054
Check answer
5.4 %
0.601
0.022
Check answer
2.2 %
0.719
0.352
Check answer
35.2 %
0.0128
Convert the following percentages into fractions by dividing by 100 and simplifying.
35%
Check answer
28%
74%
Check answer
95%
68%
Check answer
Check answer
Convert the following percentages into decimals by dividing by 100 and simplifying.
23.9%
Check answer
0.239
3.8%
8.7%
Check answer
0.087
79%
4.2%
Check answer
0.042
0.6%
58.1%
Check answer
0.581
99.9%
Solve the following applied percent problems by using a proportion.
To estimate the total number of deer in a forest, forest rangers tagged 75 deer and released them into the forest. Later, they caught a few deer and saw that 30% of them had tags. How many total deer do they estimate are in this part of the forest?
Check answer
250 deer
A bake shop wants to find out how many of their customers would like to buy a banana cream pie. They took a random sample of 280 customers and found that 96 of them like banana cream pie. Round your answer to the tenth of a percent.
For this exercise, assume that 5.3% of Americans over the age of 65 live in nursing homes. Close to 6,900 adults over 65 live in Santa Clarita, CA. How many do we expect to live in nursing homes, if the percentage is correct?
Check answer
365.7 people
We took a random sample of 600 people living in Santa Clarita, CA. We found that 306 of them were female. About what percent of Santa Clarita is female?
A slot machine game in Las Vegas wins about 8% of the time. How many plays would give an expected total of two wins? This is an expected count, not a guarantee of two wins.
Check answer
25 plays give an expected total of two wins; they do not guarantee two wins.
For this exercise, assume that 10.4% of children in CA have some sort of disability. If there is an estimated 9,400,000 children in CA, how many do we expect to have a disability?
For numbers 41-44 look at the following bar graph describing the hair color of students at a junior high school.
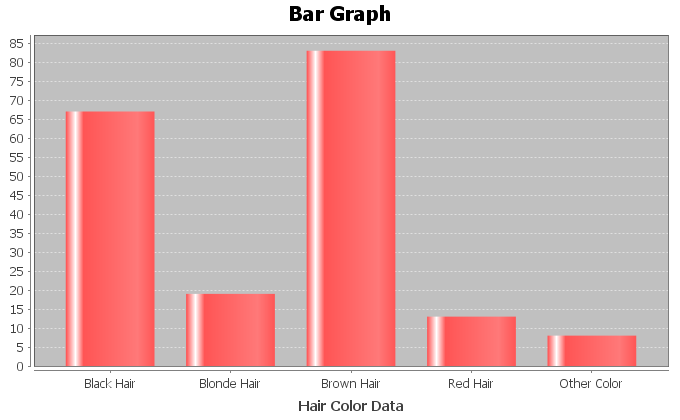
What was the most popular color hair at the school?
Check answer
Brown Hair
What was the least popular color hair at the school?
Approximately how many more students had blond hair than red hair?
Check answer
6 Students
Approximately how many more students had brown hair than black hair?
For numbers 45-49 look at the following pie chart describing the occupants of a small village as either child, teen, young adult or older adult.
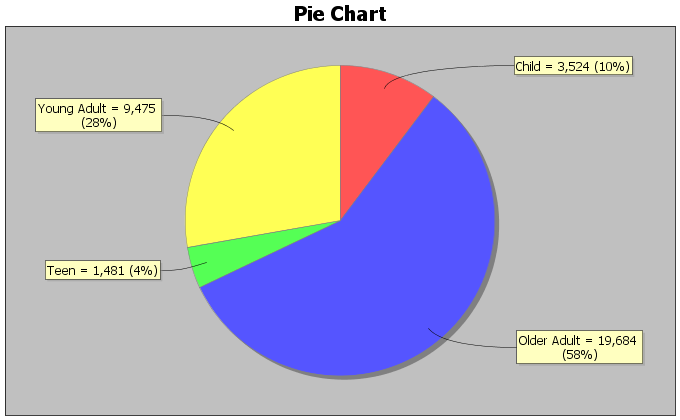
What percent of the people in the village are teenagers?
Check answer
4%
How many people in the village are older adults?
What is the difference between the percentage of young adults and the percentage of older adults?
Check answer
Using the chart’s rounded percentages, the difference is 58% − 28% = 30 percentage points.
Are there more teenagers in the town or children?
How many more young adults are there in the town than teenagers?
Check answer
7994
For numbers 50-53, look at the following bar graph describing the floor patients at a hospital were admitted to.
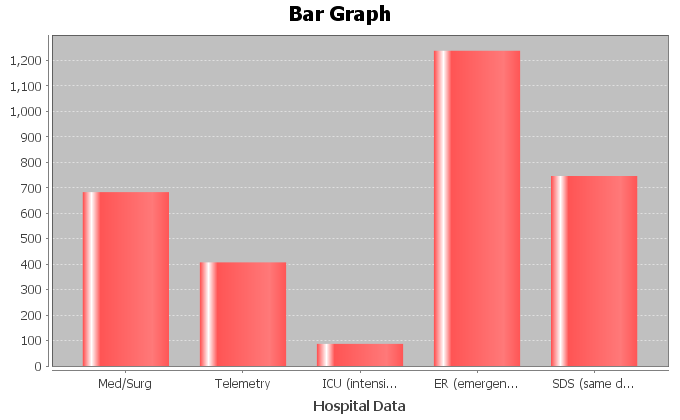
Which department had the most patients?
Which department had the fewest patients?
Check answer
ICU
Did same day surgery (SDS) see more patients than the medical/surgery (Med/Surg) floor?
Estimate how many more patients went to Telemetry than ICU?
Check answer
320
For numbers 54-59, look at the following pie chart describing the floor patients at a hospital were admitted to.
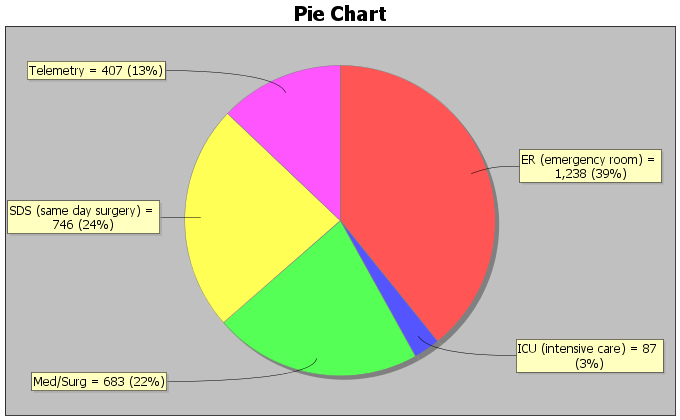
What percent of patients were admitted to the telemetry floor?
How many more patients went to SDS than Med/Surg?
Check answer
63
What is the difference between the percent of patients that went to ER and the percent of patients that went to ICU?
How many patients did ICU receive?
Check answer
87
How many more patients went to Med/Surg than Telemetry?
What is the difference between the percent of patients that went to Telemetry and the percent of patients that went to ICU?
Check answer
Using the chart’s rounded percentages, the difference is 13% − 3% = 10 percentage points.
For #60-63, look at the following bar graph describing the marriage status of students at a community college.
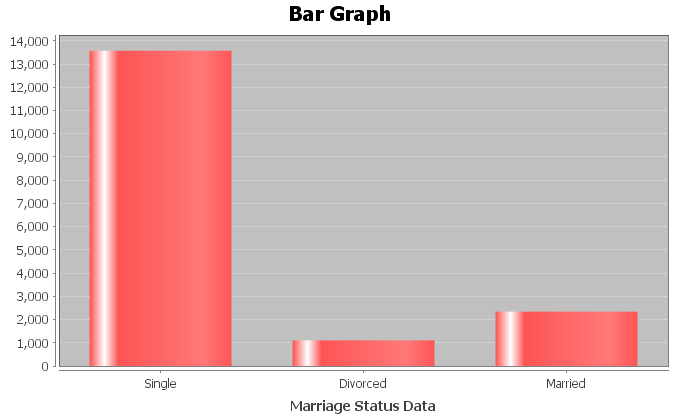
Which marriage status is most common at the college?
Approximately how many students are divorced?
Check answer
1104
Which marriage status is least common at the college?
Approximately how many more students are single than married?
Check answer
11230
For #64-67, look at the following pie chart describing the marriage status of students at a community college.
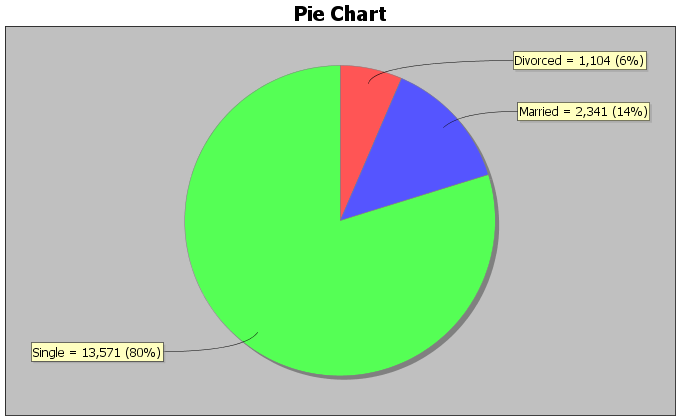
Approximately what percent of the college students are married?
Approximately what is the difference between the percent of students that are married and the percent of students that are divorced?
Check answer
Using the chart’s rounded percentages, the difference is 14% − 6% = 8 percentage points.
How many more students are single than divorced?
It was estimated that about 11% of Americans are left handed. Stacey’s apartment complex has 29 left handed people who live there. If the 11% is correct, what is the estimated total number of people who live in Stacey’s apartment complex? Round to the nearest whole person.
Check answer
Approximately 264 people (the unrounded estimate is 2900/11 people).
For this exercise, suppose a televised game has 117.7 million viewers in a population of 318.9 million people. What percent of this population watched the game?
A random sample of eligible voters shows that about 57.5% of people voted for the last presidential election. For this exercise, suppose there are 199,182 eligible voters in Santa Clarita and the sample rate applies to them. How many voted, approximately? Round to the nearest whole person.
Check answer
Approximately 114,530 eligible voters under the exercise’s assumptions.
For this exercise, assume that 62% of Americans think the U.S. will be cashless in their lifetime, with all purchases being made by credit cards, debit cards, and other electronic payments. If we were to ask 6075 people this question, how many would we expect to agree that U.S. will be cashless in their lifetime?
A doctor took a random sample of his patients. He found that 59 patients out of the 246 sampled were obese. What percent of the doctor’s sampled patients are obese? Round to the nearest hundredth of a percent.
Check answer
Approximately 23.98%.
Adapted from Preparing for Algebra and Statistics, Third Edition, by Matt Teachout. License: CC BY 4.0. Copyright and sources.