
15.11 Exercises
Selected answers
- What is the null hypothesis tested by analysis of variance?
- What are the assumptions of between-subjects analysis of
variance?
- What is a between-subjects variable?
- Why not just compute t-tests among all pairs of means instead
computing an analysis of variance?
- What is the difference between "N" and "n"?
- How is it that estimates of variance can be used to test
a hypothesis about means?
- Explain why the variance of the sample means has to be multiplied
by "n" in the computation of MSB.
- What kind of skew does the F distribution have?
- When do MSB and MSE estimate the same quantity?
- If an experiment is conducted with 6 conditions and 5 subjects
in each condition, what are dfn and dfe?
- How is the shape of the F distribution affected by the degrees
of freedom?
- What are the two components of the total sum of squares in
a one-factor between-subjects design?
- How is the mean square computed from the sum of squares?
- An experimenter is interested in the effects of two independent
variables on self esteem. What is better about conducting a factorial
experiment than conducting two separate experiements, one for
each independent variable?
- An experiment is conducted on the effect of age and treatment condition (experimental versus control) on reading speed. Which statistical term (main effect, simple effect, interaction, specific comparison) applies to each of the descriptions of effects.
- An A(3) x B(4) factorial design with 6 subjects in each
group is analyzed. Give the source and degrees of freedom columns
of the analysis of variance summary table.
- The following data are from a hypothetical study on the effects
of age and time on scores on a test of reading comprehension.
Compute the analysis of variance summary table.
- Define "Three-way interaction"
- Define interaction in terms of simple effects.
- Plot an interaction for an A(2) x B(2) design in which the
effect of B is greater at A1 than it is at A2. The dependent
variable is "Number correct." Make sure to label both
axes.
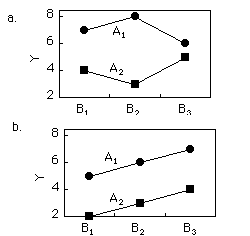
- Following are two graphs of population means for 2 x 3 designs.
For each graph, indicate which effect(s) (A, B, or A x B) are
nonzero.
- The following data are from an A(2) x B(4) factorial design.
- Why are within-subjects designs usually more powerful than
between-subjects design?
- What source of variation is found in an ANOVA summary table
for a within-subjects design that is not in in an ANOVA summary
table for a between-subjects design. What happens to this source
of variation in a between-subjects design?
- The following data contain three scores from each of five subjects.
The three scores per subject are their scores on
three trials of a memory task.
4 6 7
3 7 7
2 8 5
1 4 7
4 6 9- Compute an ANOVA
- Test all pairwise differences between means using the Bonferroni test at the .01 level.
- Test the linear and quadratic components of trend for these data.
- Give the source and df columns of the ANOVA summary table
for the following experiments:
- Twenty two subjects are each tested on a simple reaction time task and on a choice reaction time task.
- Twelve male and 12 female
subjects are each tested under three levels
of drug dosage: 0 mg, 10 mg, and 20 mg. - Twenty subjects are tested on a motor learning task for three trials a day for two days.
- An experiment is conducted in which
depressed people are either assigned to a drug therapy
group, a behavioral therapy group, or a control group.
Ten subjects are assigned to each group. The level of measured
once a month for four months.
- The dataset has
the scores (times) for males and females on each of three tasks.
a. Do a Gender (2) x Task (3) analysis of variance.
b. Plot the interaction.
- The data has four scores per subject.
- Is the design between-subjects or within-subjects?
- Create an ANOVA summary table.
Angry Moods
- Using the Anger Expression Index as the dependent variable,
perform a 2x2 ANOVA with gender and sports participation as the
two factors. Do athletes and non-athletes differ significantly
in how much anger they express? Do the genders differ significantly
in Anger Expression Index? Is the effect of sports participation
significantly different for the two genders?
- Compute a 2x2 ANOVA on this data with the following
two factors: prime type (was the first word a weapon or not?)
and word type (was the second word aggressive or non-aggressive?). Consider
carefully whether the variables are between-subject or within-subects
variables.
- Compute the ANOVA summary table.
- The effect of the treatment was larger for 15-year olds than it was for 5- or 10-year olds.
- Overall, subjects in the treatment condition performed faster than subjects in the control condition.
- The difference between the 10- and 15-year olds was significant under the treatment condition.
- The difference between the 15- year olds and the average of the 5- and 10-year olds was significant.
- As they grow older, children read faster.
| 12-year olds | 16-year olds | |
|---|---|---|
| 30 minutes | 66 68 59 72 46 | 74 71 67 82 76 |
| 60 minutes | 69 61 69 73 61 | 95 92 95 98 94 |
| B1 | B2 | B3 | B4 | |
|---|---|---|---|---|
| A1 | 1 3 4 5 | 2 2 4 5 | 3 4 2 6 | 4 5 6 8 |
| A2 | 1 1 2 2 | 2 3 2 4 | 4 6 7 8 | 8 9 9 8 |
- Compute an analysis of variance.
- Test differences among the four levels of B using the Bonferroni correction.
- Test the linear component of trend for the effect of B.
- Plot the interaction.
- Describe the interaction in words.
Questions from Case Studies:
The following question is from the
Stroop Interference
ADHD Treatment
Weapons and Aggression
Smiles and Leniency
Adapted from Online Statistics Education: A Multimedia Course of Study (onlinestatbook.com), Project Leader: David M. Lane, Rice University. Developed with NSF support. The original work is in the public domain; it is cited here at the authors' request. Changes were made: reformatted as an accessible XYZ web edition with native MathML. License: Public-Domain.