
13.5 Factors Affecting Power
Several factors affect the power of a statistical test. Some of the factors are under the control of the experimenter, whereas others are not. The following example will be used to illustrate the various factors.
Suppose a math achievement test were known to be normally distributed with a mean of 75 and a standard deviation of σ. A researcher is interested in whether a new method of teaching results in a higher mean. Assume that although the experimenter does not know it, the population mean μ for the new method is larger than 75. The researcher plans to sample N subjects and do a one-tailed test of whether the sample mean is significantly higher than 75. In this section, we consider factors that affect the probability that the researcher will correctly reject the false null hypothesis that the population mean is 75 or lower. In other words, factors that affect power.
Sample Size
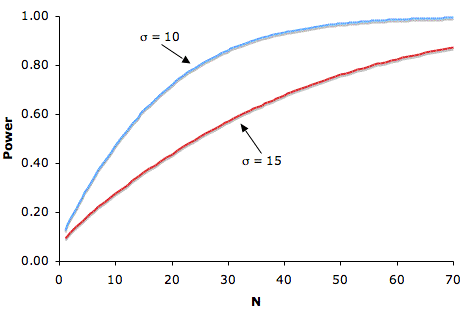
Figure 1 shows that the larger the sample size, the higher the power. Since sample size is typically under an experimenter's control, increasing sample size is one way to increase power. However, it is sometimes difficult and/or expensive to use a large sample size.
Standard Deviation
Figure 1 also shows that power is higher when the standard deviation is small than when it is large. For all values of N, power is higher for the standard deviation of 10 than for the standard deviation of 15 (except, of course, when N = 0). Experimenters can sometimes control the standard deviation by sampling from a homogeneous population of subjects, by reducing random measurement error, and/or by making sure the experimental procedures are applied very consistently.
Difference between Hypothesized and True Mean
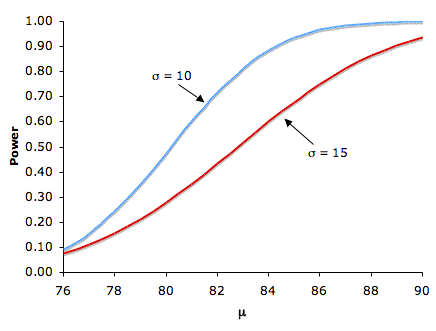
Naturally, the larger the effect size, the more likely it is that an experiment would find a significant effect. Figure 2 shows the effect of increasing the difference between the mean specified by the null hypothesis (75) and the population mean μ for standard deviations of 10 and 15.
Significance Level
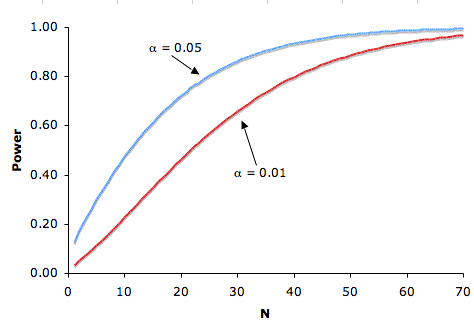
There is a trade-off between the significance level and power: the more stringent (lower) the significance level, the lower the power. Figure 3 shows that power is lower for the 0.01 level than it is for the 0.05 level. Naturally, the stronger the evidence needed to reject the null hypothesis, the lower the chance that the null hypothesis will be rejected.
One- versus Two-Tailed Tests
Power is higher with a one-tailed test than with a two-tailed test as long as the hypothesized direction is correct. A one-tailed test at the 0.05 level has the same power as a two-tailed test at the 0.10 level. A one-tailed test, in effect, raises the significance level.
Adapted from Online Statistics Education: A Multimedia Course of Study (onlinestatbook.com), Project Leader: David M. Lane, Rice University. Developed with NSF support. The original work is in the public domain; it is cited here at the authors' request. Changes were made: reformatted as an accessible XYZ web edition with native MathML. License: Public-Domain.