
10.9 Confidence Interval Simulation
This section is an interactive demonstration. The live simulation runs on the original site: open the demonstration at onlinestatbook.com.
Learning Objectives
- Develop a basic understanding of the properties of a sampling distribution based on the properties of the population.
Instructions
This simulation illustrates confidence intervals. For each run of the simulation, 100 sample experiments are conducted and a confidence interval on the mean is computed for each experiment. In each experiment, scores are sampled from a population with a mean of 50 and a standard deviation of 10. Therefore the parameter being estimated is always 50.
Both 95% and 99% confidence intervals are computed for each experiment. If the 95% confidence interval contains the population mean of 50, then the confidence interval is shown as an orange line. If the interval does not contain 50, it is shown as a red line. The 99% confidence intervals are shown by extending the 95% intervals. The extension is in blue if the 99% interval contains 50 and in white if it does not.
You can choose to make the sample size for each experiment 10, 15, or 20. One hundred simulated experiments are conducted when you click the "Sample" button. The cumulative results are shown at the bottom of the display. You can reset the cumulative results by clicking the "Clear" button.
Illustrated Instructions
The demonstrtation generates confidence intervals for sample experiments taken from a population with a mean of 50 and a standard deviation of 10. You can choose from various sample sizes but as can be seen from the figure below the default size is 10. Each time you click the sample button confidence intervals for 100 experiments are generated and displayed on the graph on the left.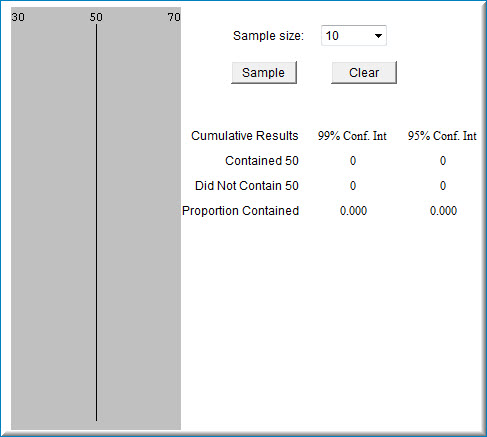
The figure below displays the results of 300 experiments with a sample size of 10. The 95% confidence intervals that contain the mean of 50 are shown in orange and the those that do not are shown in red. The 99% confidence intervals are shown in blue if they contain 50 and white if they do not.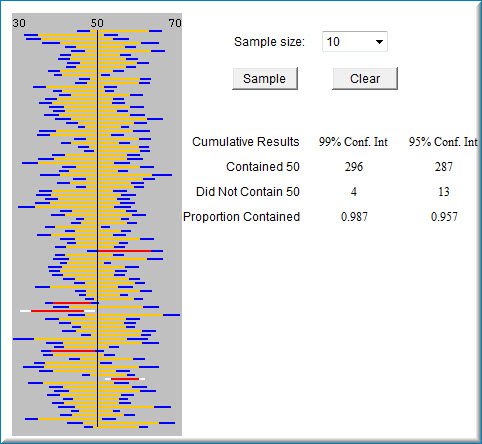
You can change the the means and standard deviations of both distributions by typing values in the respective fields below.
Adapted from Online Statistics Education: A Multimedia Course of Study (onlinestatbook.com), Project Leader: David M. Lane, Rice University. Developed with NSF support. The original work is in the public domain; it is cited here at the authors' request. Changes were made: reformatted as an accessible XYZ web edition with native MathML. License: Public-Domain.