
13.1 Temperature
Learning Objectives
By the end of this section, you will be able to:
- Define temperature.
- Convert temperatures between the Celsius, Fahrenheit, and Kelvin scales.
- Define thermal equilibrium.
- State the zeroth law of thermodynamics.
The concept of temperature has evolved from the common concepts of hot and cold. Human perception of what feels hot or cold is a relative one. For example, if you place one hand in hot water and the other in cold water, and then place both hands in tepid water, the tepid water will feel cool to the hand that was in hot water, and warm to the one that was in cold water. The scientific definition of temperature is less ambiguous than your senses of hot and cold. Temperature is operationally defined to be what we measure with a thermometer. (Many physical quantities are defined solely in terms of how they are measured. We shall see later how temperature is related to the kinetic energies of atoms and molecules, a more physical explanation.) Two accurate thermometers, one placed in hot water and the other in cold water, will show the hot water to have a higher temperature. If they are then placed in the tepid water, both will give identical readings (within measurement uncertainties). In this section, we discuss temperature, its measurement by thermometers, and its relationship to thermal equilibrium. Again, temperature is the quantity measured by a thermometer.
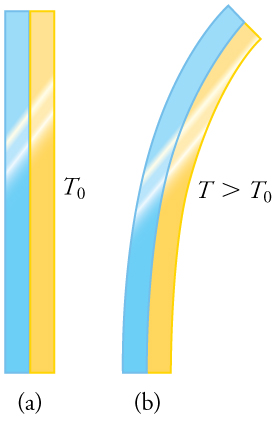
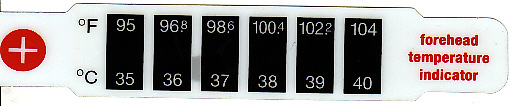
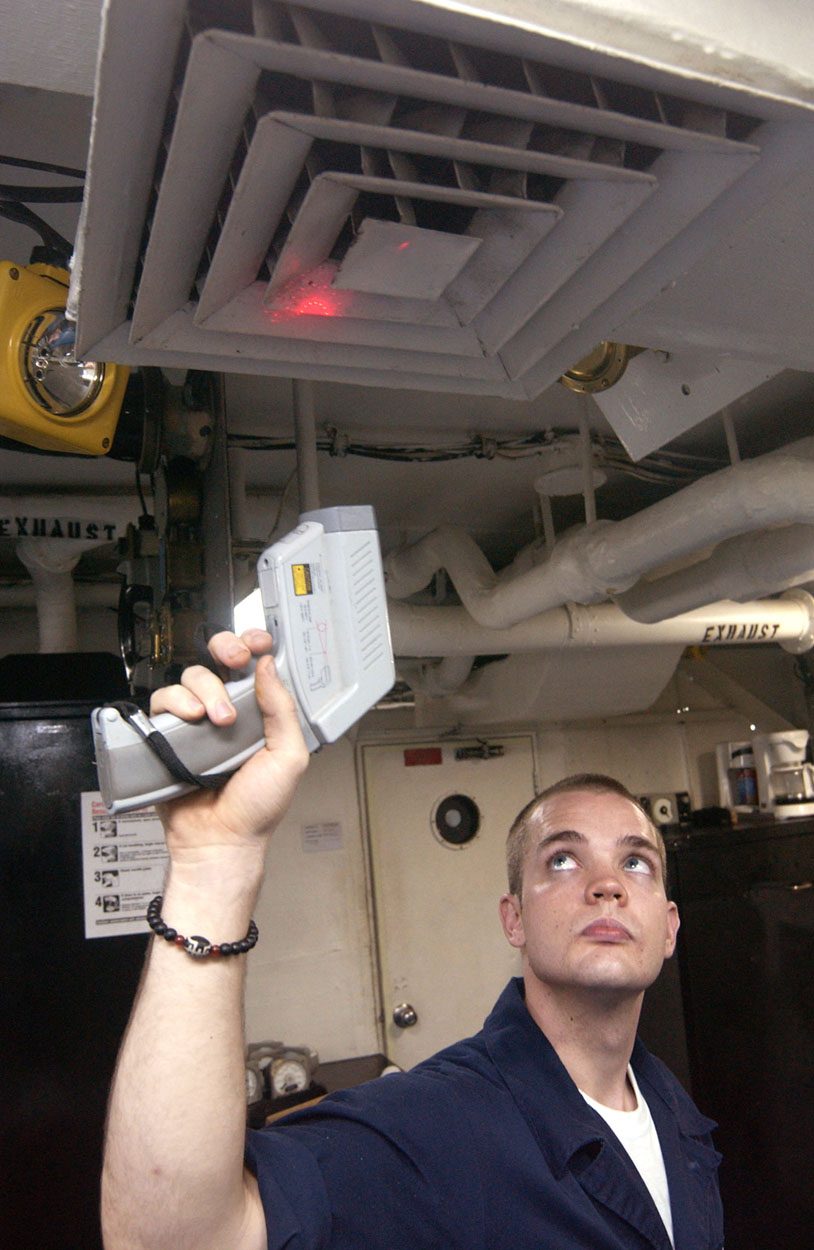
Any physical property that depends on temperature, and whose response to temperature is reproducible, can be used as the basis of a thermometer. Because many physical properties depend on temperature, the variety of thermometers is remarkable. For example, volume increases with temperature for most substances. This property is the basis for the common alcohol thermometer, the old mercury thermometer, and the bimetallic strip (Figure 13.4). Other properties used to measure temperature include electrical resistance and color, as shown in Figure 13.5, and the emission of infrared radiation, as shown in Figure 13.6.

Temperature Scales
Thermometers are used to measure temperature according to well-defined scales of measurement, which use pre-defined reference points to help compare quantities. The three most common temperature scales are the Fahrenheit, Celsius, and Kelvin scales. A temperature scale can be created by identifying two easily reproducible temperatures. The freezing and boiling temperatures of water at standard atmospheric pressure are commonly used.
The Celsius scale (which replaced the slightly different centigrade scale) has the freezing point of water at and the boiling point at . Its unit is the degree Celsius. On the Fahrenheit scale (still the most frequently used in the United States), the freezing point of water is at and the boiling point is at . The unit of temperature on this scale is the degree Fahrenheit. Note that a temperature difference of one degree Celsius is greater than a temperature difference of one degree Fahrenheit. Only 100 Celsius degrees span the same range as 180 Fahrenheit degrees, thus one degree on the Celsius scale is 1.8 times larger than one degree on the Fahrenheit scale
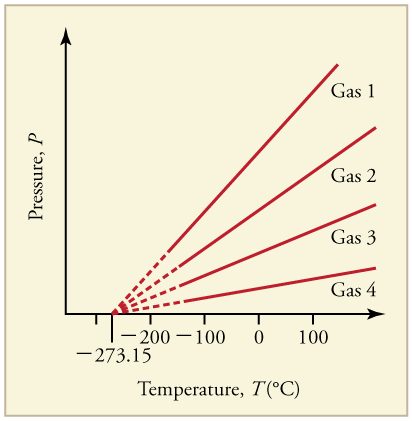
The Kelvin scale is the temperature scale that is commonly used in science. It is an absolute temperature scale defined to have 0 K at the lowest possible temperature, called absolute zero. The official temperature unit on this scale is the kelvin, which is abbreviated K, and is not accompanied by a degree sign. The freezing and boiling points of water are 273.15 K and 373.15 K, respectively. Thus, the magnitude of temperature differences is the same in units of kelvins and degrees Celsius. Unlike other temperature scales, the Kelvin scale is an absolute scale. It is used extensively in scientific work because a number of physical quantities, such as the volume of an ideal gas, are directly related to absolute temperature. The kelvin is the SI unit used in scientific work.
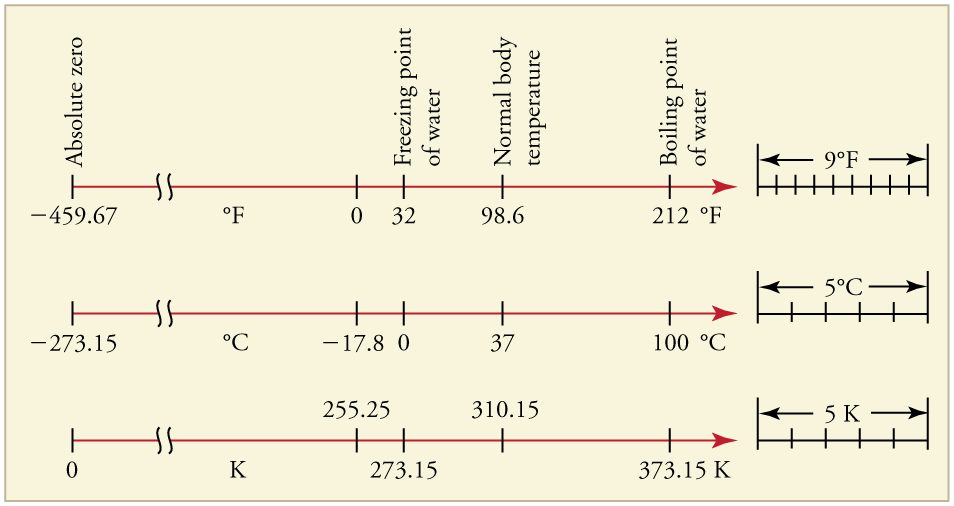
The relationships between the three common temperature scales is shown in Figure 13.7. Temperatures on these scales can be converted using the equations in Table 13.1.
| To convert from... | Use this equation... | Also written as... |
|---|---|---|
| Celsius to Fahrenheit | ||
| Fahrenheit to Celsius | ||
| Celsius to Kelvin | ||
| Kelvin to Celsius | ||
| Fahrenheit to Kelvin | ||
| Kelvin to Fahrenheit |
Notice that the conversions between Fahrenheit and Kelvin look quite complicated. In fact, they are simple combinations of the conversions between Fahrenheit and Celsius, and the conversions between Celsius and Kelvin.
Temperature Ranges in the Universe
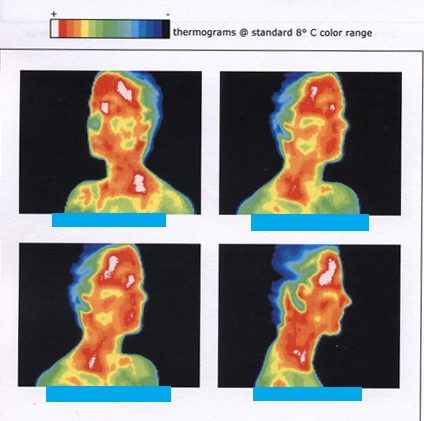
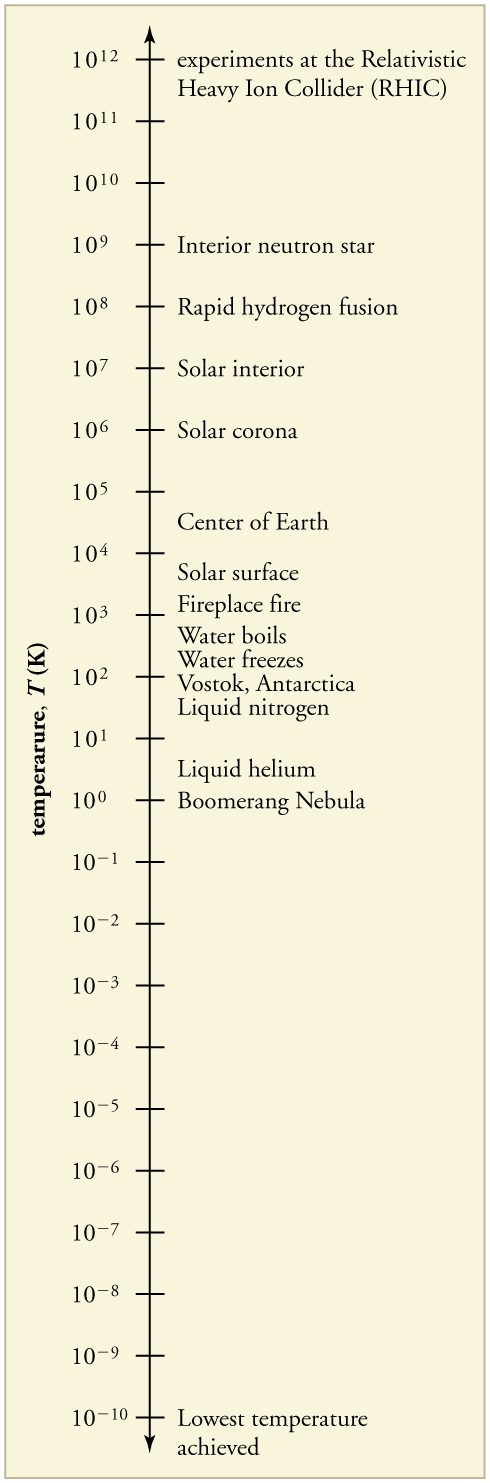
Figure 13.9 shows the wide range of temperatures found in the universe. Human beings have been known to survive with body temperatures within a small range, from to to ). The average normal body temperature is usually given as (), and variations in this temperature can indicate a medical condition: a fever, an infection, a tumor, or circulatory problems (see Figure 13.8).
The lowest temperatures ever recorded have been measured during laboratory experiments: at the Massachusetts Institute of Technology (USA), and at Helsinki University of Technology (Finland). In comparison, the coldest recorded place on Earth’s surface is Vostok, Antarctica at 183 K , and the coldest place (outside the lab) known in the universe is the Boomerang Nebula, with a temperature of 1 K.
Thermal Equilibrium and the Zeroth Law of Thermodynamics
Thermometers actually take their own temperature, not the temperature of the object they are measuring. This raises the question of how we can be certain that a thermometer measures the temperature of the object with which it is in contact. It is based on the fact that any two systems placed in thermal contact (meaning heat transfer can occur between them) but isolated from the rest of the environment, will reach the same temperature. That is, heat will flow from the hotter object to the cooler one until they have exactly the same temperature. The objects are then in thermal equilibrium, and no further heat flow or changes in temperature will occur. Thus, if enough time is allowed for this transfer of heat to run its course, the temperature a thermometer registers does represent the system with which it is in thermal equilibrium. Thermal equilibrium is established when two bodies are in contact with each other and can freely exchange energy. A single object is said to be in internal thermal equilibrium when no heat is flowing within the object and therefore its temperature is uniform.
Furthermore, experimentation has shown that if two systems, A and B, are in thermal equilibrium with each another, and B is in thermal equilibrium with a third system C, then A is also in thermal equilibrium with C. This conclusion may seem obvious, because all three have the same temperature, but it is basic to thermodynamics. It is called the zeroth law of thermodynamics.
This law was postulated in the 1930s, after the first and second laws of thermodynamics had been developed and named. It is called the zeroth law because it comes logically before the first and second laws (discussed in Thermodynamics). Suppose, for example, a cold metal block and a hot metal block are both placed on a metal plate at room temperature. Eventually the cold block and the plate will be in thermal equilibrium. In addition, the hot block and the plate will be in thermal equilibrium. By the zeroth law, we can conclude that the cold block and the hot block are also in thermal equilibrium. Similarly, two thermometers placed in thermal contact, one with one block and the second with the other block, will also be in thermal equilibrium and therefore read the same temperature. This establishes temperature as a meaningful concept.
Does the temperature of a body in internal thermal equilibrium depend on its size?
No, the system can be divided into smaller parts. Since no heat is flowing, each part is in equilibrium with the adjacent part, and according to the zeroth law, this means all parts are in equilibrium with each other and are at the same temperature. Quantities that are independent of size are called intensive quantities. Temperature is an intensive quantity.
Section Summary
- Temperature is the quantity measured by a thermometer.
- Temperature is related to the average kinetic energy of atoms and molecules in a system.
- Absolute zero is the temperature at which there is no molecular motion.
- There are three main temperature scales: Celsius, Fahrenheit, and Kelvin.
- Temperatures on one scale can be converted to temperatures on another scale using the following equations:
- Systems are in thermal equilibrium when they have the same temperature.
- Thermal equilibrium occurs when two bodies are in contact with each other and can freely exchange energy.
- The zeroth law of thermodynamics states that when two systems, A and B, are in thermal equilibrium with each other, and B is in thermal equilibrium with a third system, C, then A is also in thermal equilibrium with C.
Conceptual Questions
What does it mean to say that two systems are in thermal equilibrium?
Give an example of a physical property that varies with temperature and describe how it is used to measure temperature.
When a cold alcohol thermometer is placed in a hot liquid, the column of alcohol goes down slightly before going up. Explain why.
If you add boiling water to a cup at room temperature, what would you expect the final equilibrium temperature of the unit to be? You will need to include the surroundings as part of the system. Consider the zeroth law of thermodynamics.
Problems & Exercises
What is the Fahrenheit temperature of a person with a fever?
Frost damage to most plants occurs at temperatures of or lower. What is this temperature on the Kelvin scale?
To conserve energy, room temperatures are kept at in the winter and in the summer. What are these temperatures on the Celsius scale?
and
A tungsten light bulb filament may operate at 2900 K. What is its Fahrenheit temperature? What is this on the Celsius scale?
The surface temperature of the Sun is about 5750 K. What is this temperature on the Fahrenheit scale?
One of the hottest temperatures ever recorded on the surface of Earth was in Death Valley, CA. What is this temperature in Celsius degrees? What is this temperature in Kelvin?
(a) Suppose a cold front blows into your locale and drops the temperature by 40.0 Fahrenheit degrees. How many degrees Celsius does the temperature decrease when there is a decrease in temperature? (b) Show that any change in temperature in Fahrenheit degrees is nine-fifths the change in Celsius degrees.
(a)
(b)
(a) At what temperature do the Fahrenheit and Celsius scales have the same numerical value? (b) At what temperature do the Fahrenheit and Kelvin scales have the same numerical value?
Adapted from College Physics 2e by OpenStax (openstax.org), licensed under CC BY-NC-SA 4.0. Changes were made. License: CC-BY-NC-SA-4.0.